今日看到一篇新闻,该新闻称《2010年中国城市房价排行榜》近日揭晓,杭州房价跃居榜首。该文列出了2010年7月中国城市房价排行榜数据如下:
cities <- readRDS("cities.rds")
print(cities)
##        city   lon      lat hours_eprice
## 1      杭州 30.16   120.10        25840
## 2      北京 39.55   116.24        22310
## 3      温州 28.01   120.39        18854
## 4      三亚 18.14   109.31        18319
## 5      深圳 22.33   114.07        16978
## 6      宁波 29.52   121.33        13438
## 7      广州 23.08   113.14        12560
## 8      南京 32.03   118.46        12016
## 9      舟山 30.01   122.06        10500
## 10     绍兴 30.00   120.34        10105
## 11     珠海 22.17   113.34         9747
## 12     大连 38.55   121.36         9678
## 13     厦门 24.27   118.06         9660
## 14     苏州 31.19   120.37         9103
## 15     台州 28.41   121.27         8967
## 16     青岛 36.03   120.18         8962
## 17     天津 39.02   117.12         8958
## 18     南通 32.01   120.51         8950
## 19     福州 26.05   119.18         8666
## 20     湖州 30.52   120.06         8220
## 21   哈尔滨 45.44   126.36         7939
## 22     无锡 31.34   120.18         7843
## 23     佛山 23.02   113.06         7822
## 24     济南 36.40   117.00         7760
## 25     泉州 24.56   118.36         7680
## 26     嘉兴 30.46   120.45         7587
## 27     海口 20.02   110.20         7288
## 28     东莞 23.02   113.45         7023
## 29     成都 30.40   104.04         6630
## 30     合肥 31.52   117.17         6255
## 31     武汉 30.35   114.17         6196
## 32     南宁 22.48   108.19         6137
## 33     唐山 39.36   118.11         6098
## 34     昆明 25.04   102.42         6006
## 35     金华 29.07   119.39         6000
## 36     中山 22.31   113.22         5988
## 37     烟台 37.32   121.24         5835
## 38     重庆 29.35   106.33         5720
## 39     日照 35.23   119.32         5700
## 40     郑州 34.46 11340.00         5689
## 41     惠州 23.05   114.22         5649
## 42     宜昌 30.42   111.17         5637
## 43     太原 37.54   112.33         5635
## 44     扬州 32.23   119.26         5630
## 45     南昌 28.40   115.55         5573
## 46     长春 43.54   125.19         5445
## 47     兰州 36.04   103.51         5440
## 48     西安 34.17   108.57         5398
## 49     威海 37.31   122.07         5363
## 50     长沙 28.12   112.59         5339
## 51     常州 31.47   119.58         5302
## 52     江门 22.35   113.04         5205
## 53     鞍山 41.07   123.00         5150
## 54   秦皇岛 39.55   119.35         5114
## 55     漳州 24.31   117.39         5110
## 56     泰安 36.11   117.08         5100
## 57     镇江 32.11   119.27         5052
## 58     承德 40.59   117.57         5016
## 59     沈阳 41.48   123.25         4980
## 60 呼和浩特 40.48   111.41         4920
## 61   石家庄 38.02   114.30         4874
## 62     桂林 25.17   110.17         4865
## 63     泰州 32.30   119.54         4830
## 64     柳州 23.19   109.24         4822
## 65     大庆 46.36   125.01         4814
## 66     湛江 21.11   110.24         4772
## 67     九江 29.43   115.58         4771
## 68     银川 38.27   106.16         4690
## 69     徐州 34.15   117.11         4632
## 70     贵阳 26.35   106.42         4534
## 71 乌鲁木齐 43.45    87.36         4410
## 72     东营 37.27   118.30         4370
## 73     汕头 23.22   116.41         4330
## 74     邯郸 36.36   114.28         4300
## 75     包头 40.39   109.49         4225
## 76     洛阳 34.41   112.27         4207
## 77     延安 36.35   109.28         4135
## 78     吉林 43.52   126.33         4008
## 79     济宁 35.23   116.33         3950
## 80     北海 21.28   109.07         3890
## 81     开封 34.47   114.21         3737
## 82   葫芦岛 40.45   120.51         3719
## 83     潍坊 36.43   119.06         3689
## 84 齐齐哈尔 47.20   123.57         3671
## 85     清远 23.42   113.01         3625
## 86     营口 40.39   122.13         3580
## 87     锦州 41.07   121.09         3550
## 88     西宁 36.38   101.48         3440
## 89     襄樊 32.02   112.08         3432
## 90     拉萨 29.39    91.08         3400
## 91     淄博 36.48   118.03         3300
## 92     丹东 40.08   124.22         3273
## 93     喀什 39.30    75.59         3250
## 94   张家口 40.48   114.53         3210
## 95 克拉玛依 45.36    84.51         3200
用R将其可视化:
# 安装包(如果未安装)
# install.packages(c("ggplot2", "sf", "dplyr","ggrepel"))

# 加载包
library(ggplot2)
library(sf)
## Linking to GEOS 3.13.0, GDAL 3.8.5, PROJ 9.5.1; sf_use_s2() is TRUE
library(dplyr)
##
## 载入程序包:'dplyr'
## The following objects are masked from 'package:stats':
##
##     filter, lag
## The following objects are masked from 'package:base':
##
##     intersect, setdiff, setequal, union
library(ggrepel)
library(showtext)
## 载入需要的程序包:sysfonts
## 载入需要的程序包:showtextdb
# 下载中国地图数据(GADM级别0,全国)
china_map <- st_read("https://geodata.ucdavis.edu/gadm/gadm4.1/json/gadm41_CHN_0.json")
## Reading layer `gadm41_CHN_0' from data source
##   `https://geodata.ucdavis.edu/gadm/gadm4.1/json/gadm41_CHN_0.json'
##   using driver `GeoJSON'
## Simple feature collection with 4 features and 2 fields
## Geometry type: MULTIPOLYGON
## Dimension:     XY
## Bounding box:  xmin: 73.5577 ymin: 18.1593 xmax: 134.7739 ymax: 53.56
## Geodetic CRS:  WGS 84
cities <- readRDS("cities.rds")

ggplot() +
  geom_sf(data = china_map, fill = "lightblue", color = "gray40") +  # 绘制地图边界
  geom_point(data = cities[1:20,], aes(x = lat, y = lon), color = "red", size = 2) +  # 标记城市点
  geom_text_repel(data = cities[1:20,], aes(x = lat, y = lon, label = city),
            hjust = -0.1, vjust = 0.5, color = "darkred", size = 3) +  # 添加城市标签
  coord_sf(xlim = c(73, 135), ylim = c(18, 54)) +  # 设置地图范围(中国区域)
  labs(title = "中国主要城市分布图", x = "经度", y = "纬度") +
  theme_minimal() +
  theme(plot.title = element_text(hjust = 0.5, face = "bold",family="PingFang SC"))
## Warning: ggrepel: 2 unlabeled data points (too many overlaps). Consider
## increasing max.overlaps
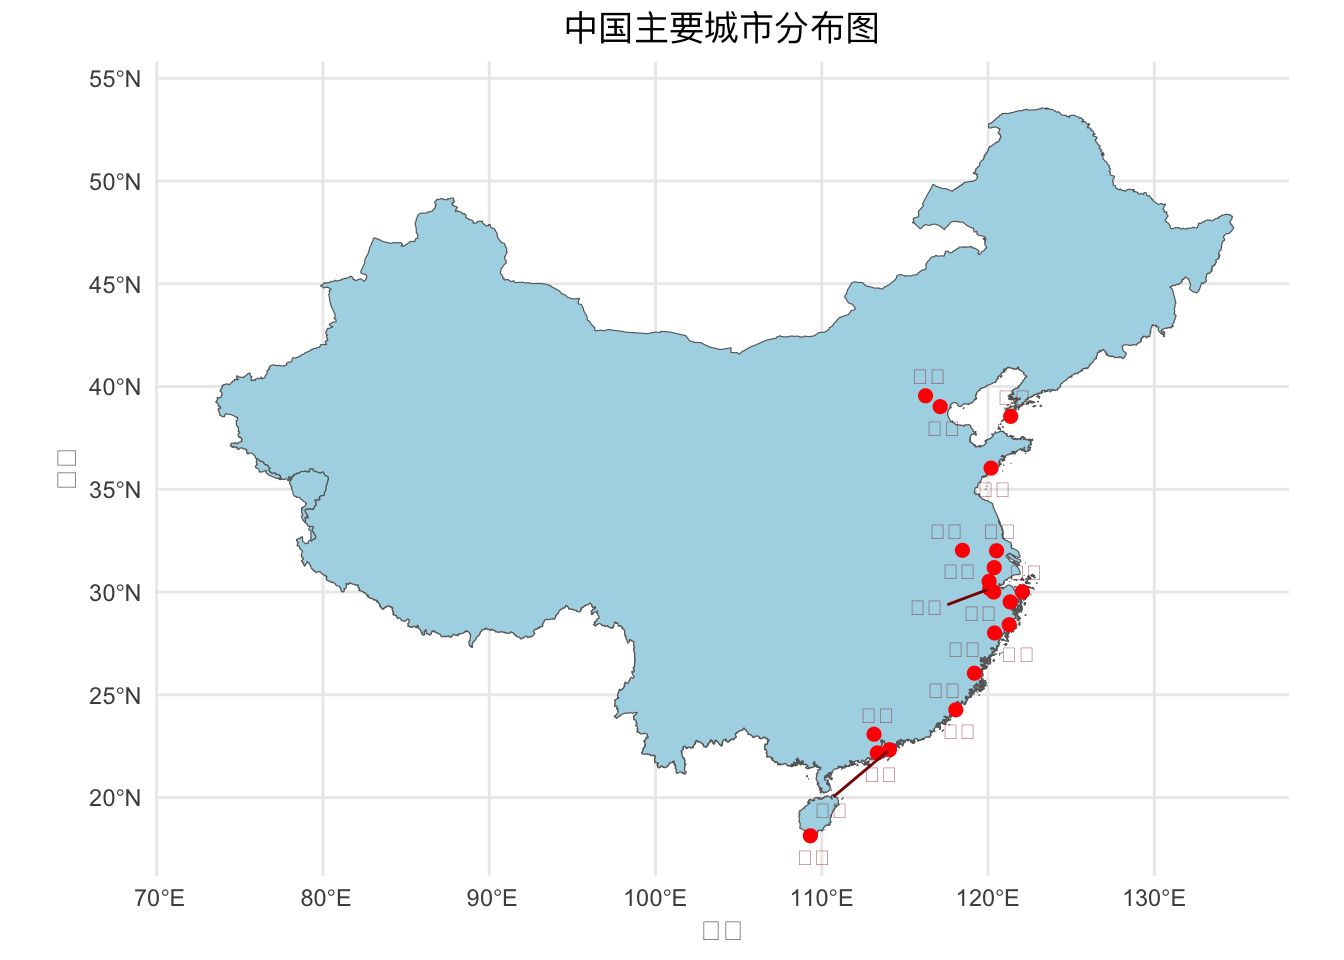
果不其然,全都在沿海。