很久之前整理的关于R绘制维恩图的资料,虽然,用R绘制维恩图并不是很常见,还是记下一笔,以备需要者参考。
# Gplots包
library(gplots)
##
## 载入程序包:'gplots'
## The following object is masked from 'package:stats':
##
##     lowess
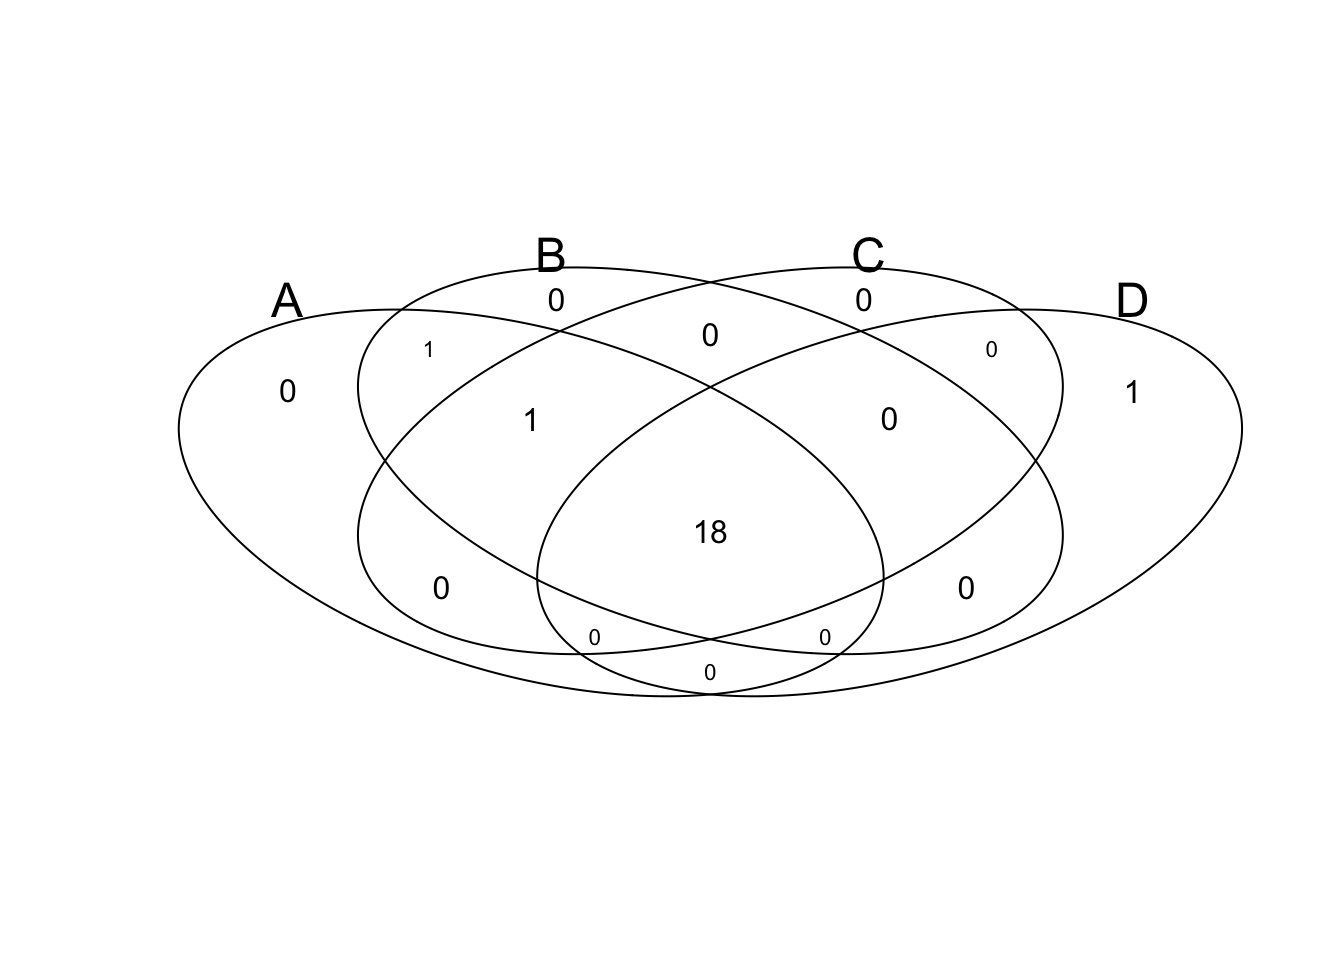
A<- 1:20
B<- 1:20
C<- 2:20
D<- 3:21

input<-list(A,B,C,D)
input
## [[1]]
##  [1]  1  2  3  4  5  6  7  8  9 10 11 12 13 14 15 16 17 18 19 20
##
## [[2]]
##  [1]  1  2  3  4  5  6  7  8  9 10 11 12 13 14 15 16 17 18 19 20
##
## [[3]]
##  [1]  2  3  4  5  6  7  8  9 10 11 12 13 14 15 16 17 18 19 20
##
## [[4]]
##  [1]  3  4  5  6  7  8  9 10 11 12 13 14 15 16 17 18 19 20 21
venn(input)
A<- as.logical(rbinom(100, 1, 0.2))
B<- as.logical(rbinom(100, 1, 0.7))
C<- as.logical(rbinom(100, 1, 0.2))
D<- as.logical(rbinom(100, 1, 0.1))
input<-data.frame(A,B,C,D)
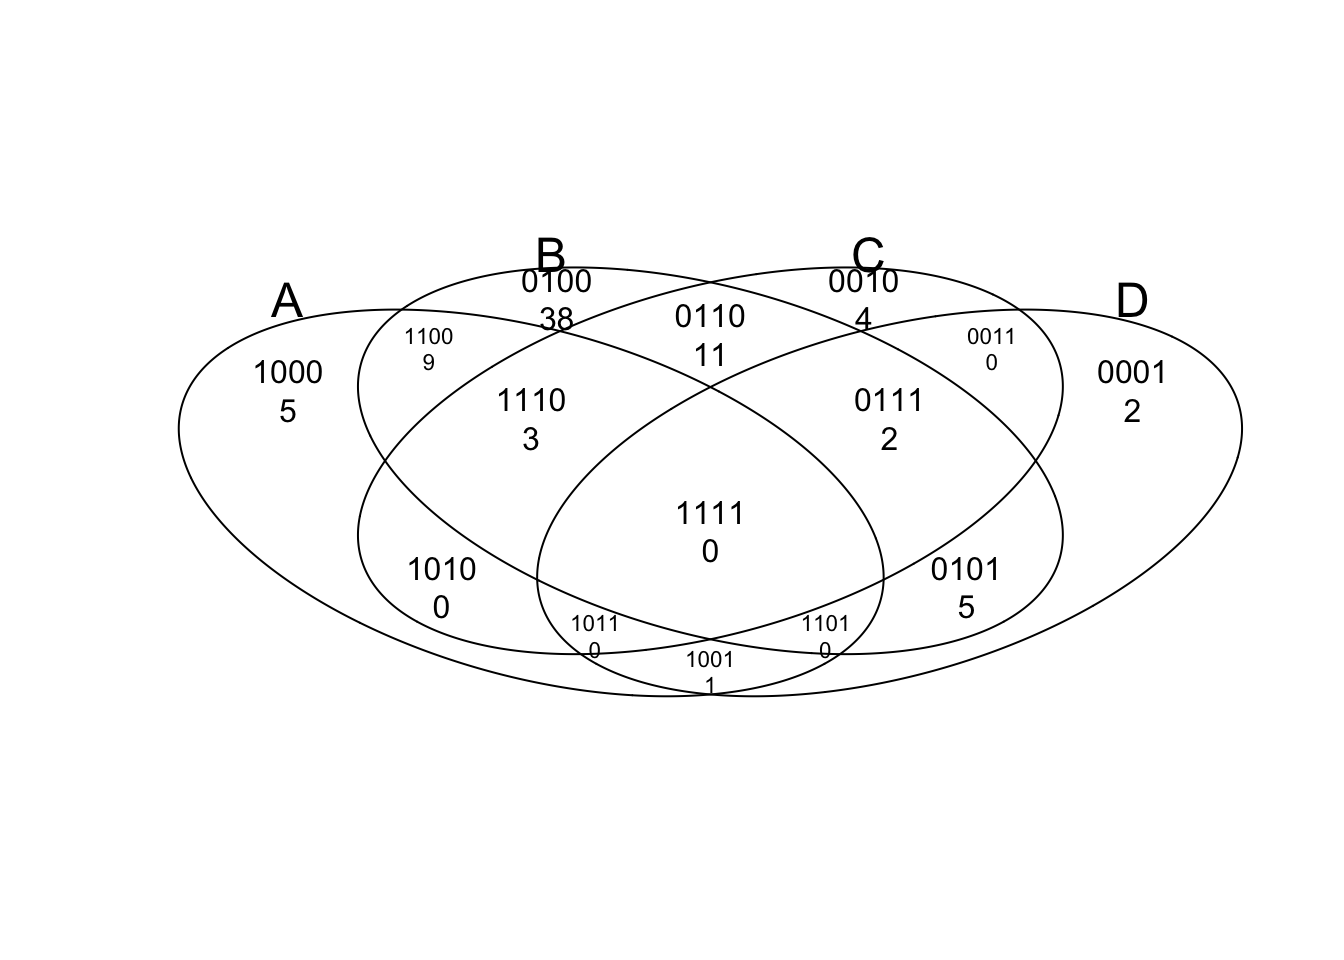
venn(input)
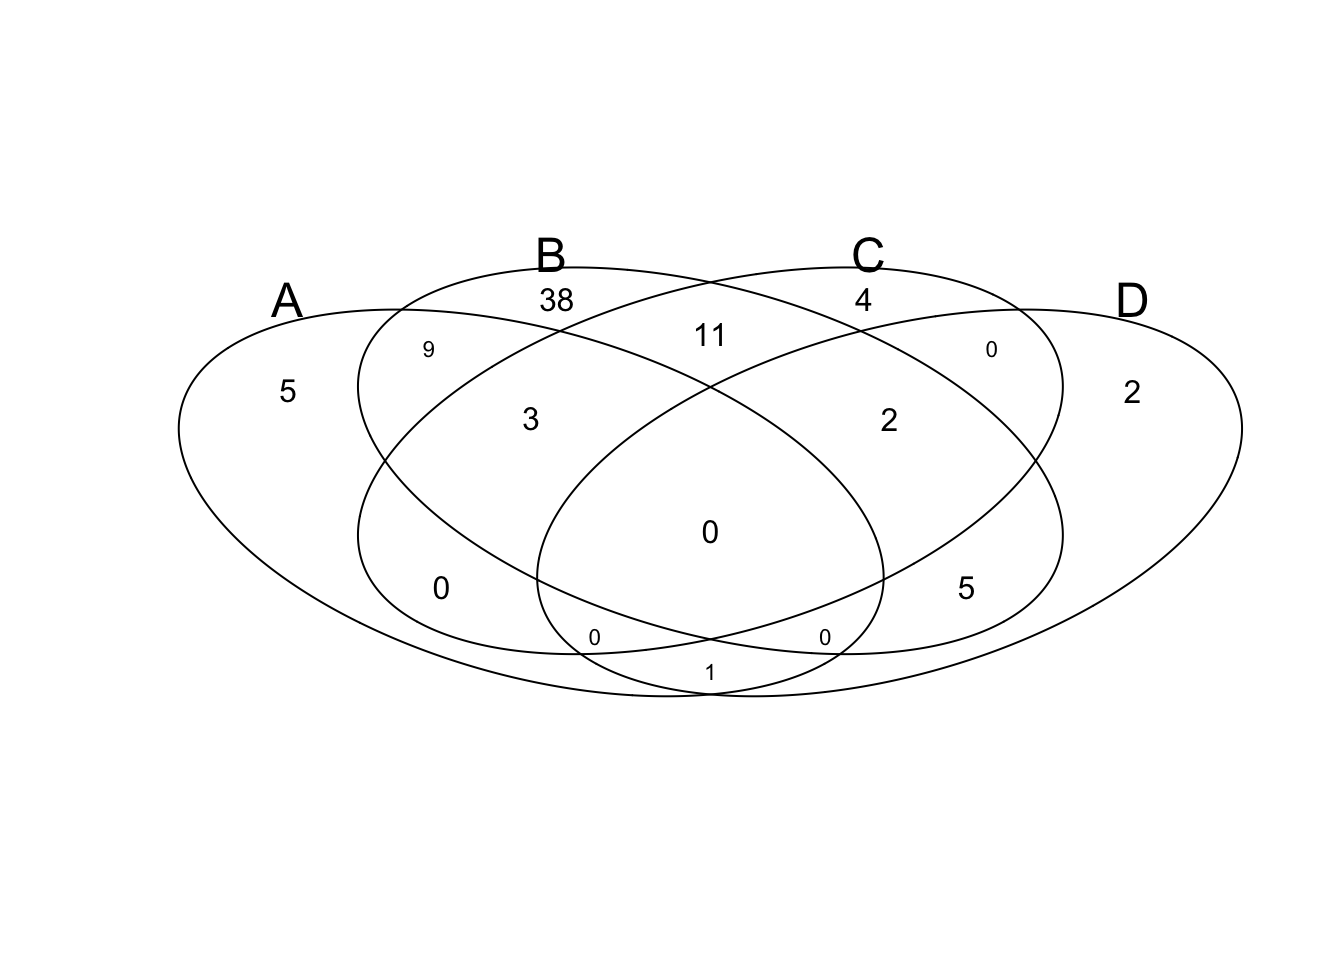
tmp <- venn(input, simplify=TRUE)
## Warning in drawVennDiagram(data = counts, small = small, showSetLogicLabel = showSetLogicLabel, : Not shown: 0101 contains 2
tmp
##      num A B C D
## 0000   0 0 0 0 0
## 0001   1 0 0 0 1
## 0010   4 0 0 1 0
## 0011   0 0 0 1 1
## 0100  36 0 1 0 0
## 0101   2 0 1 0 1
## 0110   6 0 1 1 0
## 0111   1 0 1 1 1
## 1000   5 1 0 0 0
## 1001   0 1 0 0 1
## 1010   0 1 0 1 0
## 1011   1 1 0 1 1
## 1100  15 1 1 0 0
## 1101   1 1 1 0 1
## 1110   6 1 1 1 0
## 1111   1 1 1 1 1
## attr(,"intersections")
## attr(,"intersections")$A
## [1] "18" "29" "32" "54" "58"
##
## attr(,"intersections")$B
##  [1] "12"  "14"  "19"  "22"  "28"  "30"  "34"  "36"  "40"  "43"  "45"  "46"
## [13] "51"  "52"  "53"  "57"  "60"  "66"  "67"  "68"  "69"  "70"  "73"  "75"
## [25] "76"  "77"  "78"  "80"  "81"  "87"  "88"  "89"  "92"  "94"  "98"  "100"
##
## attr(,"intersections")$C
## [1] "6"  "10" "33" "84"
##
## attr(,"intersections")$D
## [1] "79"
##
## attr(,"intersections")$`A:B`
##  [1] "2"  "5"  "9"  "13" "17" "21" "25" "26" "27" "38" "39" "44" "49" "50" "56"
##
## attr(,"intersections")$`B:C`
## [1] "20" "71" "72" "82" "83" "97"
##
## attr(,"intersections")$`B:D`
## [1] "62" "63"
##
## attr(,"intersections")$`A:B:C`
## [1] "3"  "11" "47" "74" "85" "95"
##
## attr(,"intersections")$`A:B:D`
## [1] "96"
##
## attr(,"intersections")$`A:C:D`
## [1] "7"
##
## attr(,"intersections")$`B:C:D`
## [1] "23"
##
## attr(,"intersections")$`A:B:C:D`
## [1] "37"
##
## attr(,"class")
## [1] "venn"
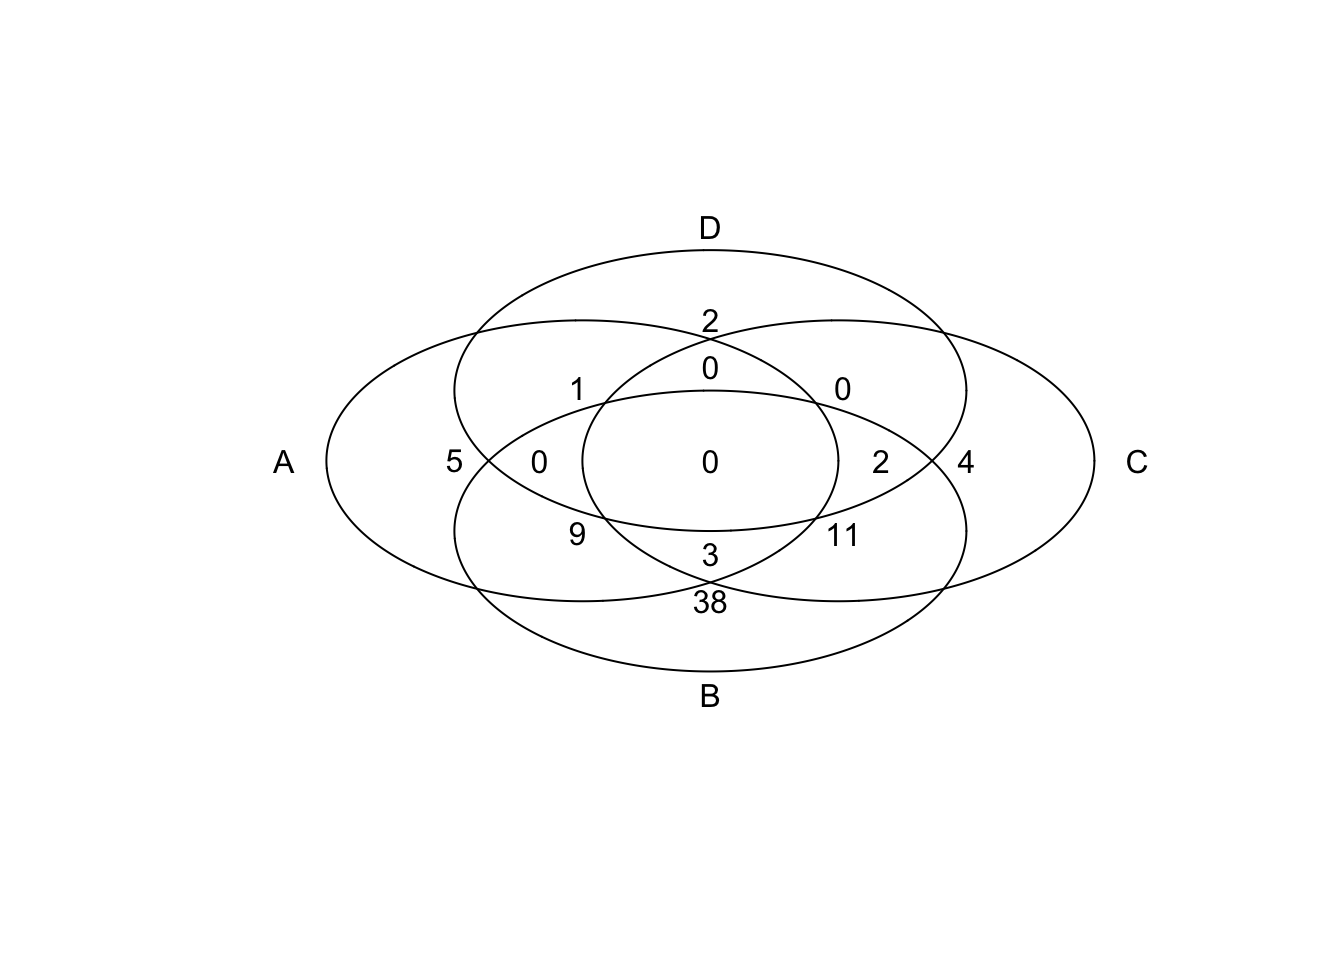
venn(input, showSetLogicLabel=TRUE)
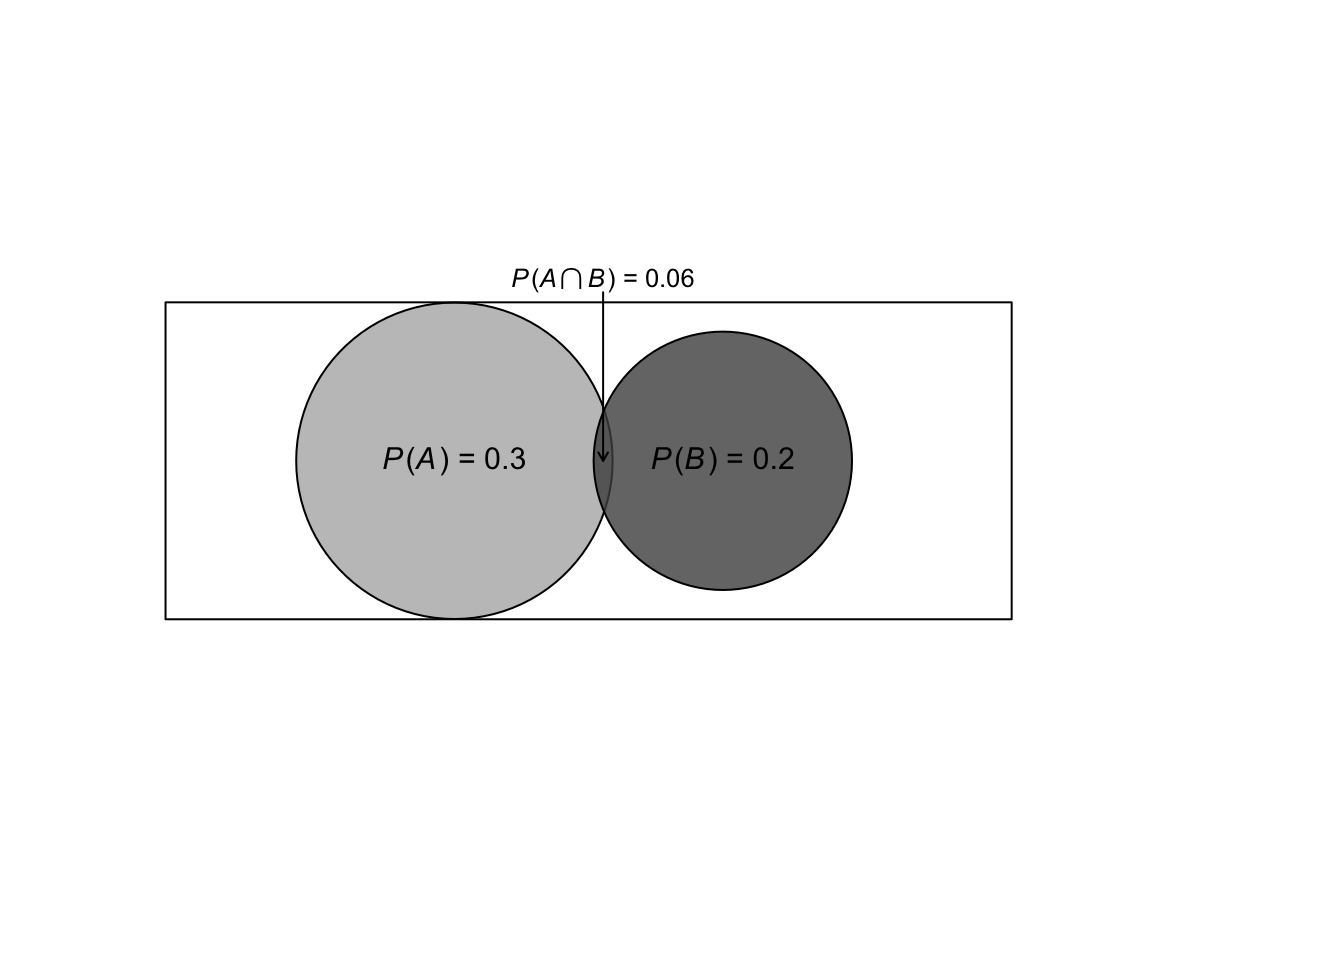
# asbio包
library(asbio)
## 载入需要的程序包:tcltk
Venn(A=.3,B=.2,AandB=.06)
# limma包
# install.packages("BiocManager")
# BiocManager::install("limma")
library(limma)
Y <- matrix(rnorm(100*6),100,6)
Y[1:10,3:4] <- Y[1:10,3:4]+3
Y[1:20,5:6] <- Y[1:20,5:6]+3
design <- cbind(1,c(0,0,1,1,0,0),c(0,0,0,0,1,1))
fit <- eBayes(lmFit(Y,design))
results <- decideTests(fit)
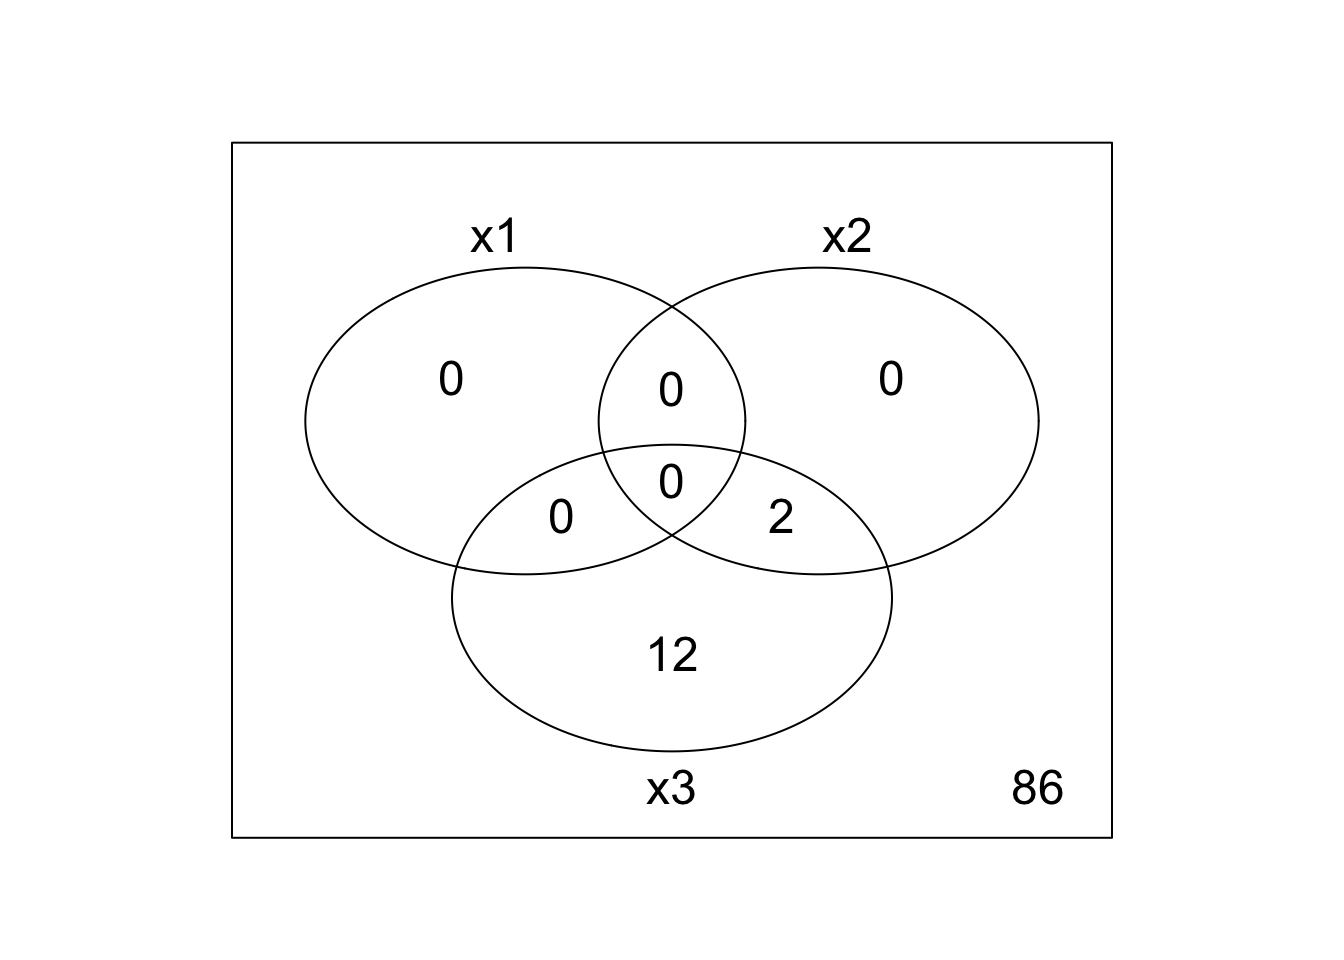
a <- vennCounts(results)
print(a)
##   x1 x2 x3 Counts
## 1  0  0  0     88
## 2  0  0  1      8
## 3  0  1  0      0
## 4  0  1  1      4
## 5  1  0  0      0
## 6  1  0  1      0
## 7  1  1  0      0
## 8  1  1  1      0
## attr(,"class")
## [1] "VennCounts"
vennDiagram(a)
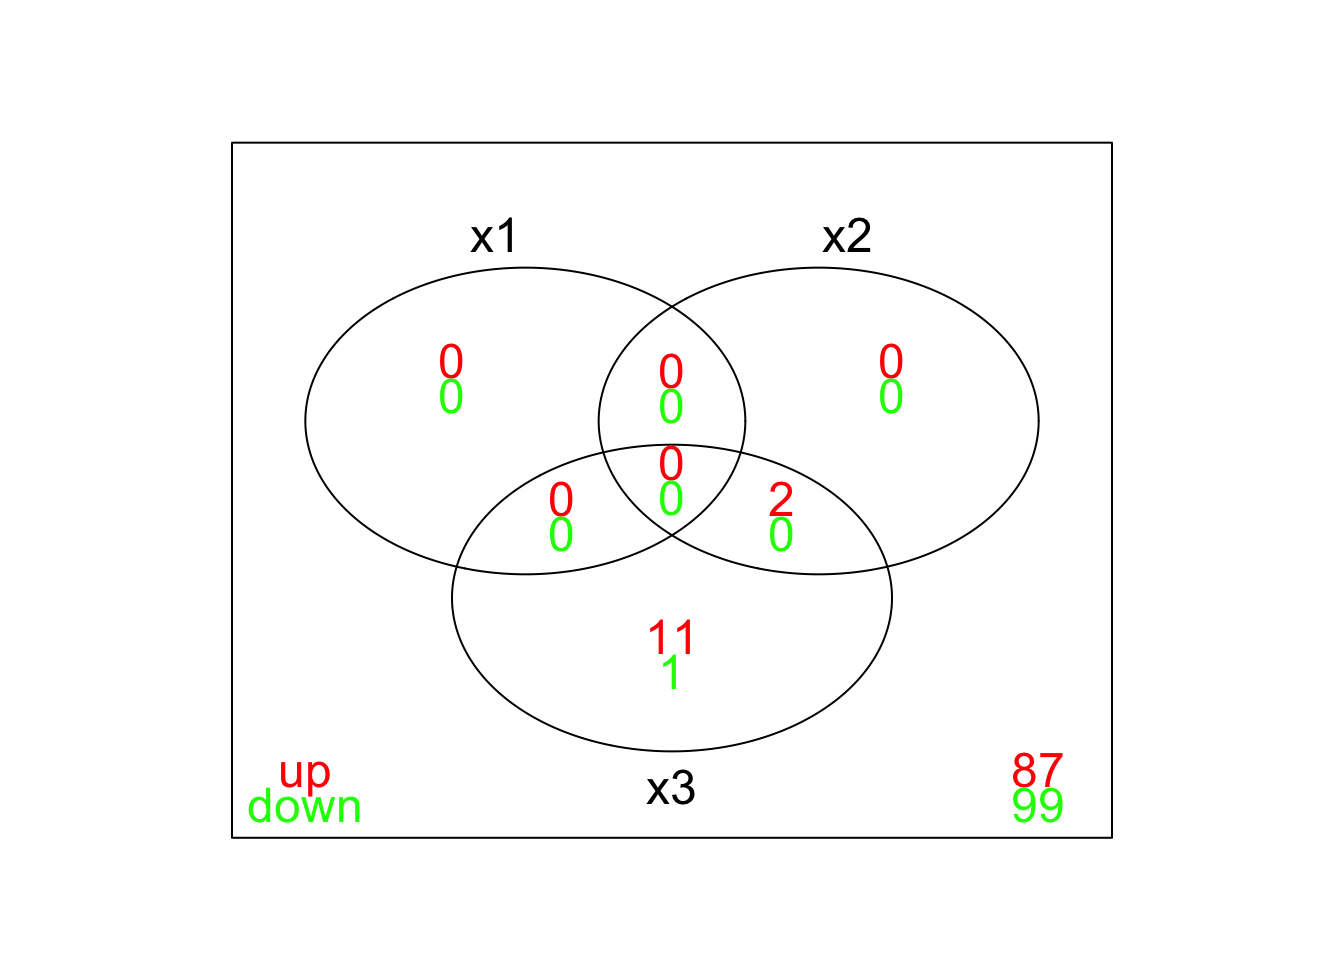
vennDiagram(results,include=c("up","down"),counts.col=c("red","green"))
# venneuler包

library(venneuler)
## 载入需要的程序包:rJava
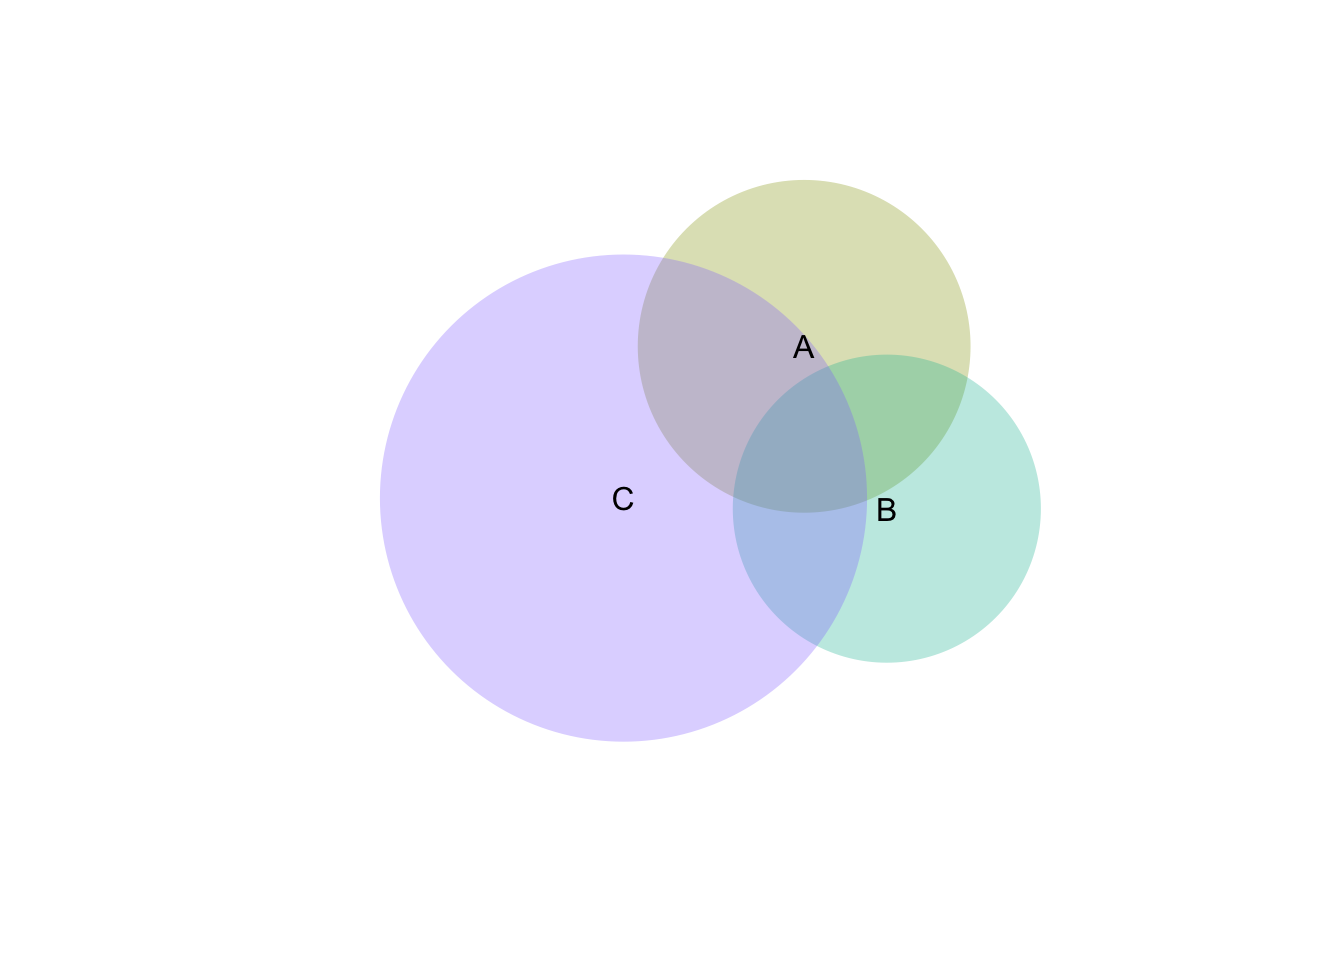
vd <- venneuler(c(A=0.3, B=0.3, C=1.1, "A&B"=0.1, "A&C"=0.2, "B&C"=0.1 ,"A&B&C"=0.1))

plot(vd)
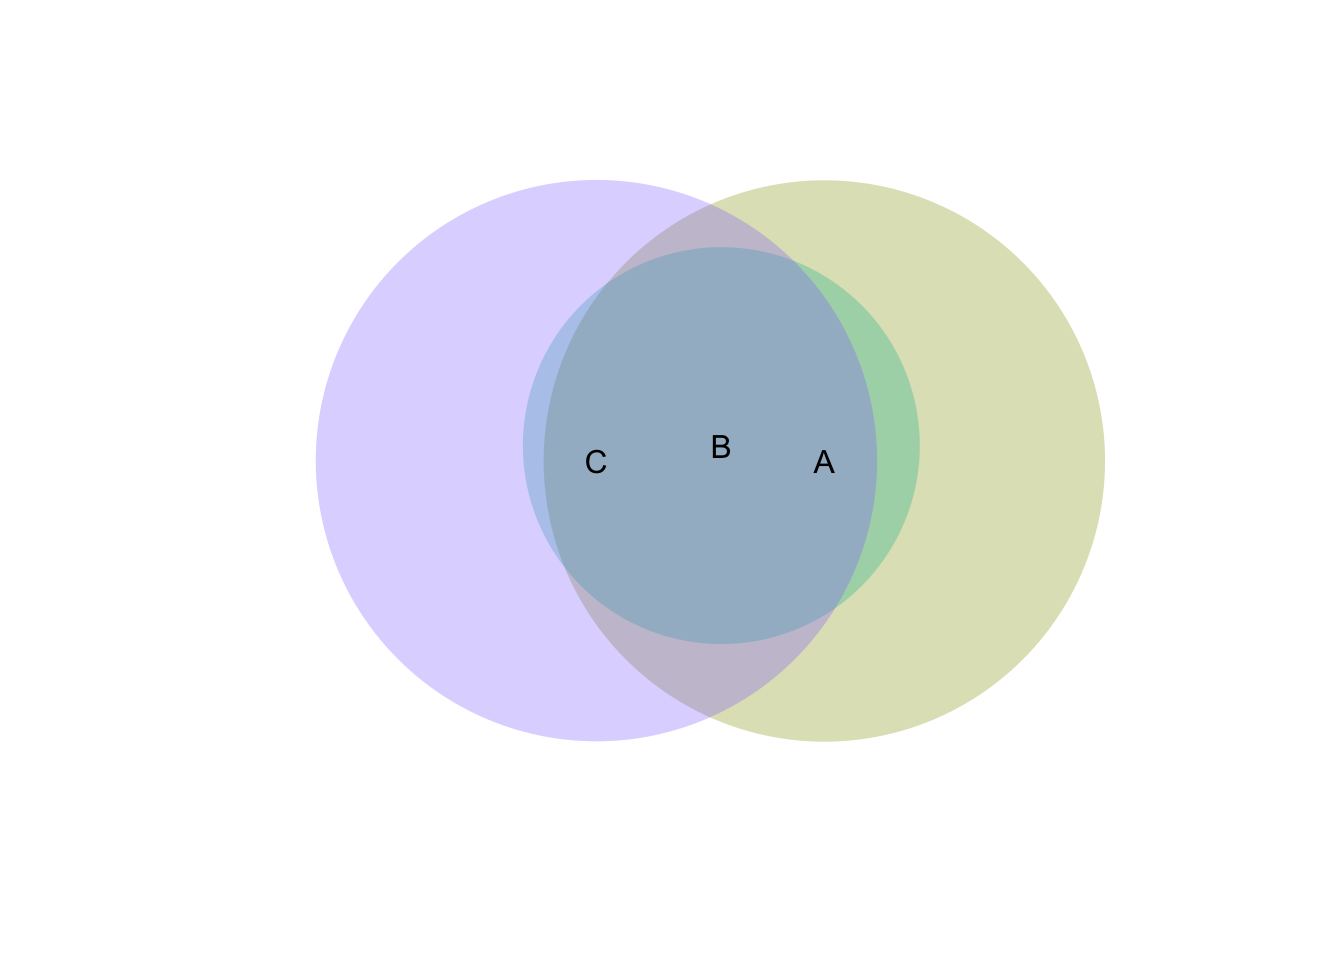
m <- data.frame(elements=c("1","2","2","2","3"),sets=c("A","A","B","C","C"))

v <- venneuler(m)

plot(v)
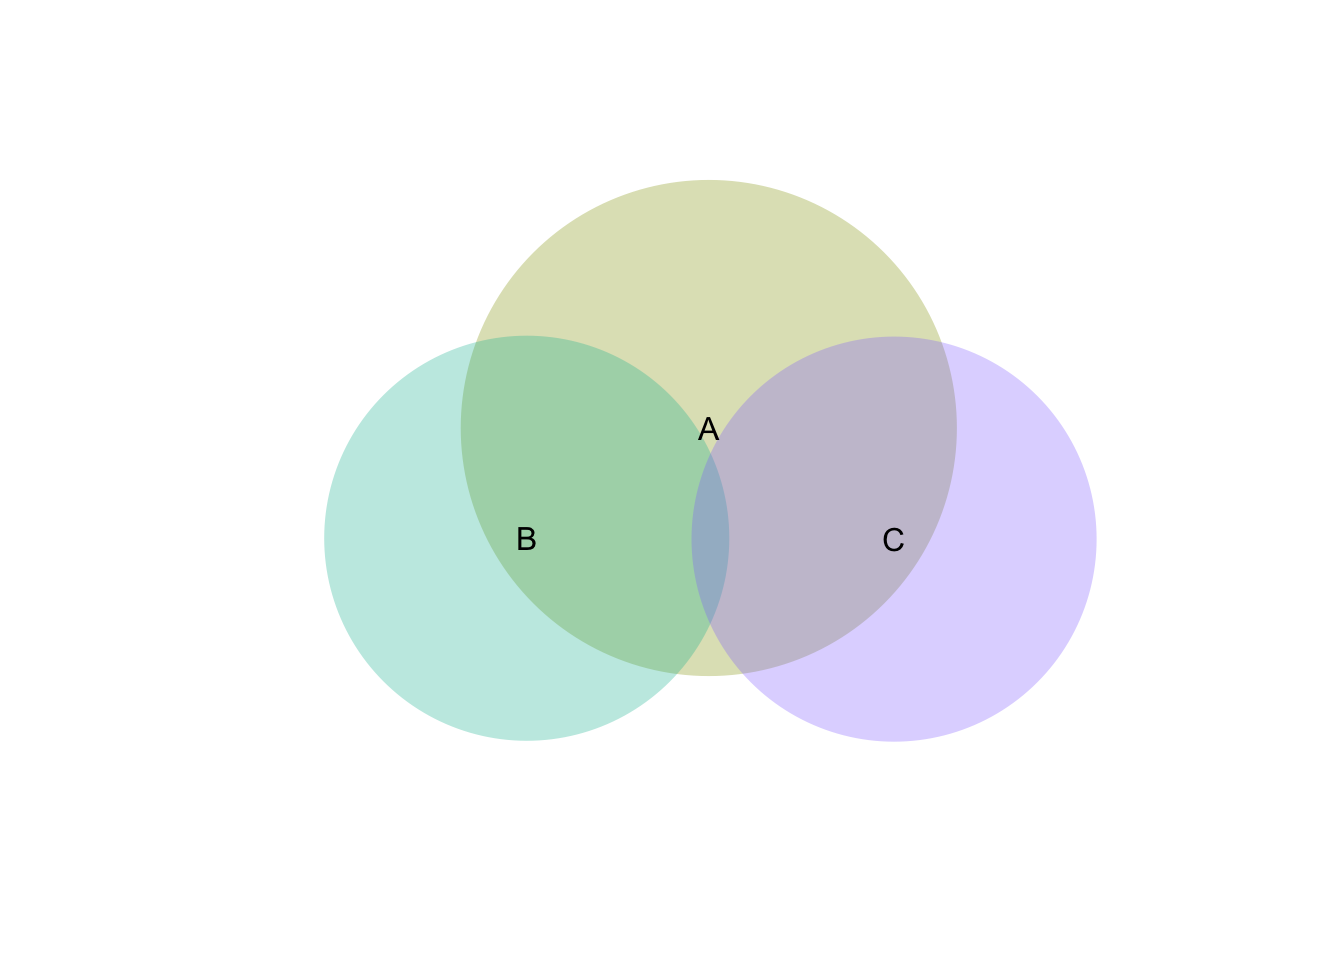
m <- as.matrix(data.frame(A=c(1.5, 0.2, 0.4, 0, 0),B=c(0, 0.2, 0, 1, 0), C=c(0, 0, 0.3, 0, 1)))

v <- venneuler(m > 0)

plot(v)
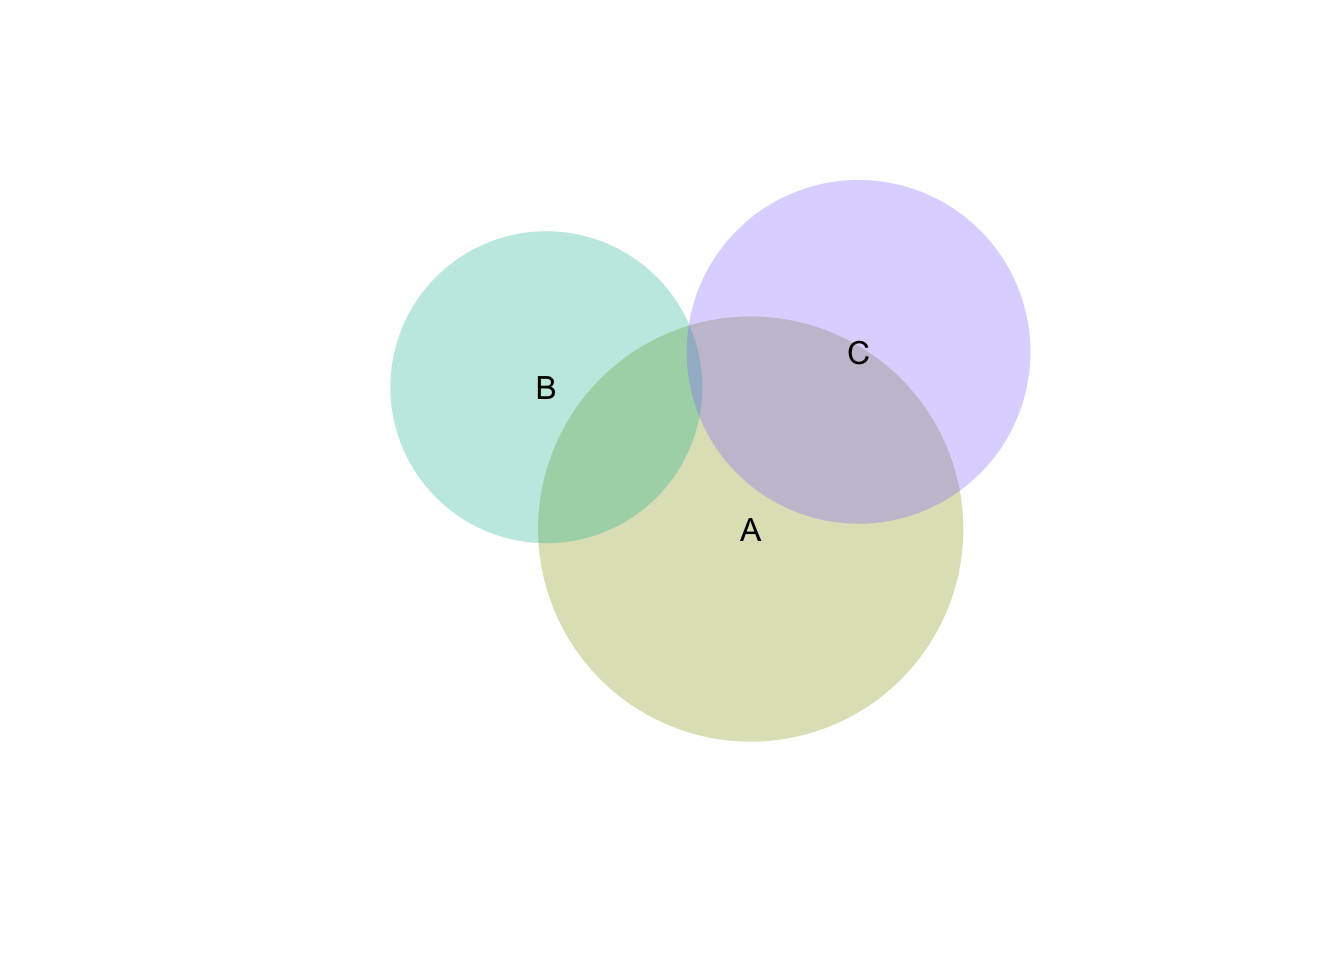
v <- venneuler(m)

plot(v)
# Vennerable包

# BiocManager::install("graph")
# BiocManager::install("RBGL")
# BiocManager::install("reshape")
# install.packages("Vennerable", repos="http://R-Forge.R-project.org")

library(Vennerable)
## 载入需要的程序包:graph
## 载入需要的程序包:BiocGenerics
## 载入需要的程序包:generics
##
## 载入程序包:'generics'
## The following objects are masked from 'package:base':
##
##     as.difftime, as.factor, as.ordered, intersect, is.element, setdiff,
##     setequal, union
##
## 载入程序包:'BiocGenerics'
## The following objects are masked from 'package:rJava':
##
##     anyDuplicated, duplicated, unique
## The following object is masked from 'package:limma':
##
##     plotMA
## The following objects are masked from 'package:stats':
##
##     IQR, mad, sd, var, xtabs
## The following objects are masked from 'package:base':
##
##     anyDuplicated, aperm, append, as.data.frame, basename, cbind,
##     colnames, dirname, do.call, duplicated, eval, evalq, Filter, Find,
##     get, grep, grepl, is.unsorted, lapply, Map, mapply, match, mget,
##     order, paste, pmax, pmax.int, pmin, pmin.int, Position, rank,
##     rbind, Reduce, rownames, sapply, saveRDS, table, tapply, unique,
##     unsplit, which.max, which.min
## 载入需要的程序包:RBGL
## 载入需要的程序包:grid
## 载入需要的程序包:lattice
## 载入需要的程序包:RColorBrewer
## 载入需要的程序包:reshape
## 载入需要的程序包:gtools
## 载入需要的程序包:xtable
##
## 载入程序包:'Vennerable'
## The following object is masked from 'package:asbio':
##
##     Venn
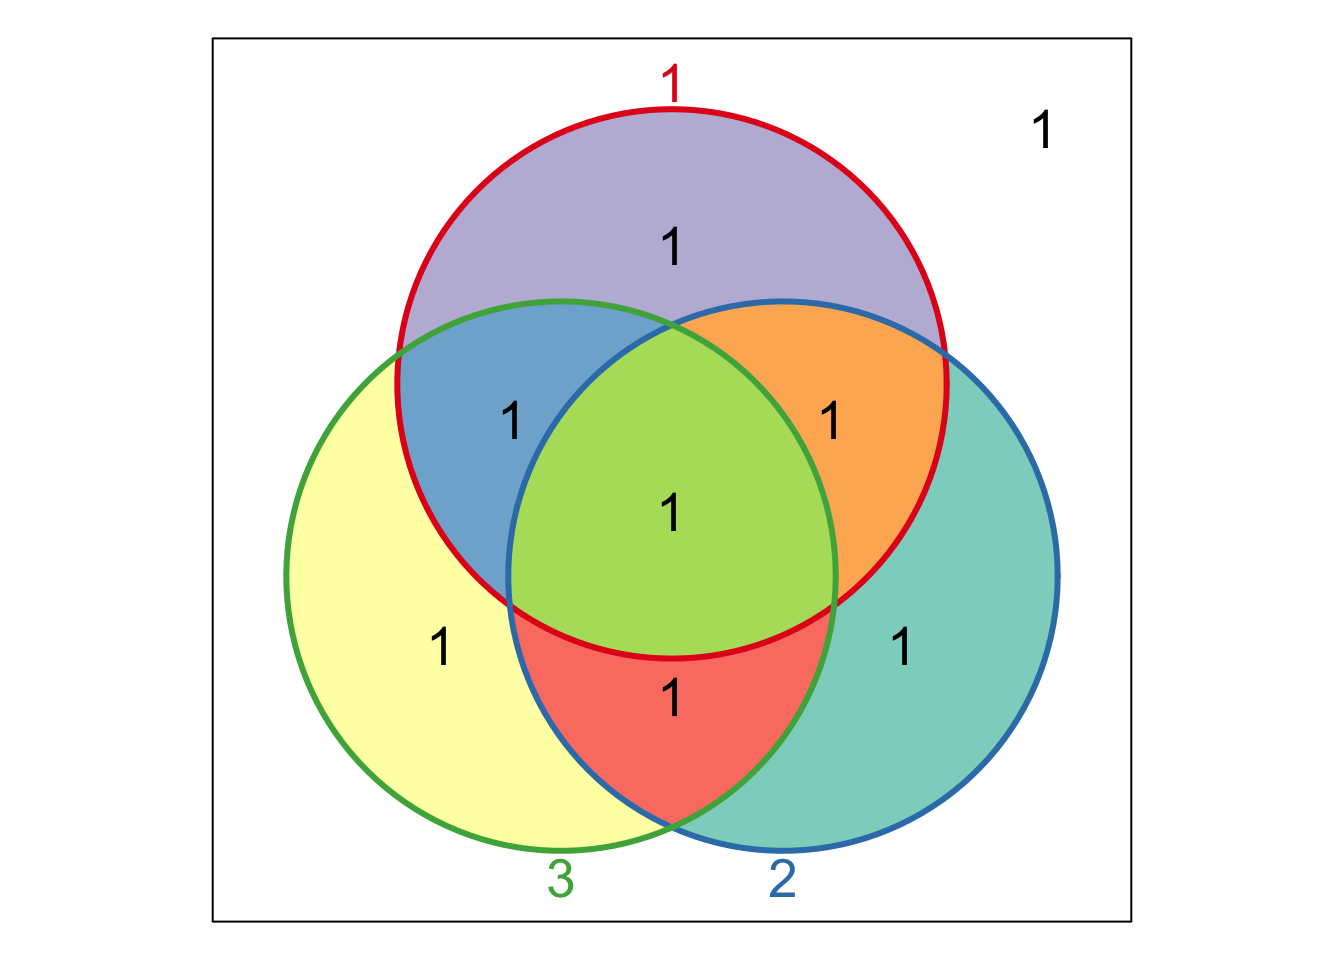
Venn(n=3)
## A Venn object on 3 sets named
## 1,2,3
## 000 100 010 110 001 101 011 111
##   1   1   1   1   1   1   1   1
plot(Venn(n=3))
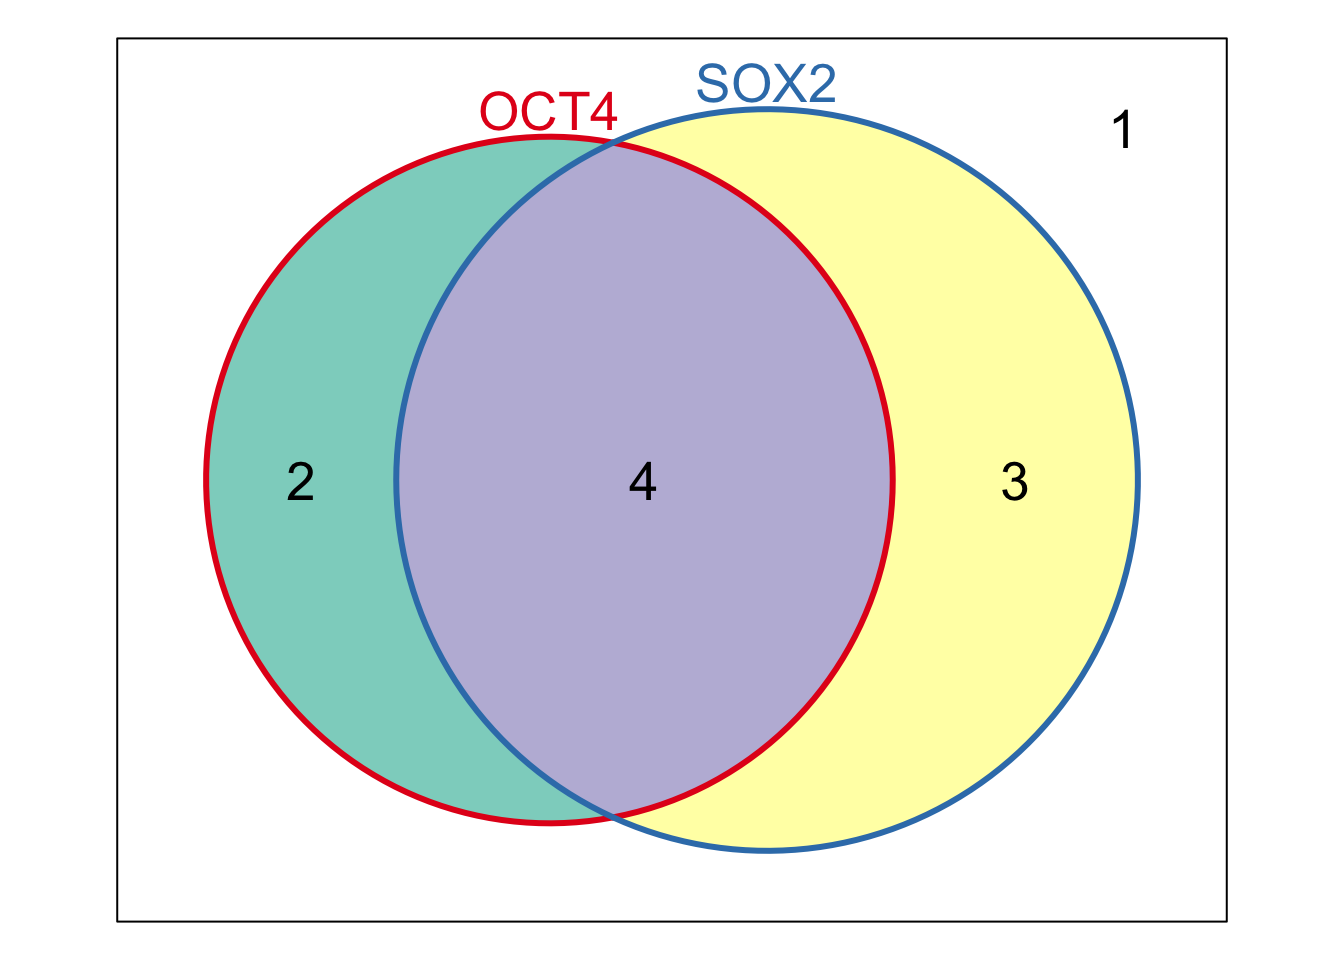
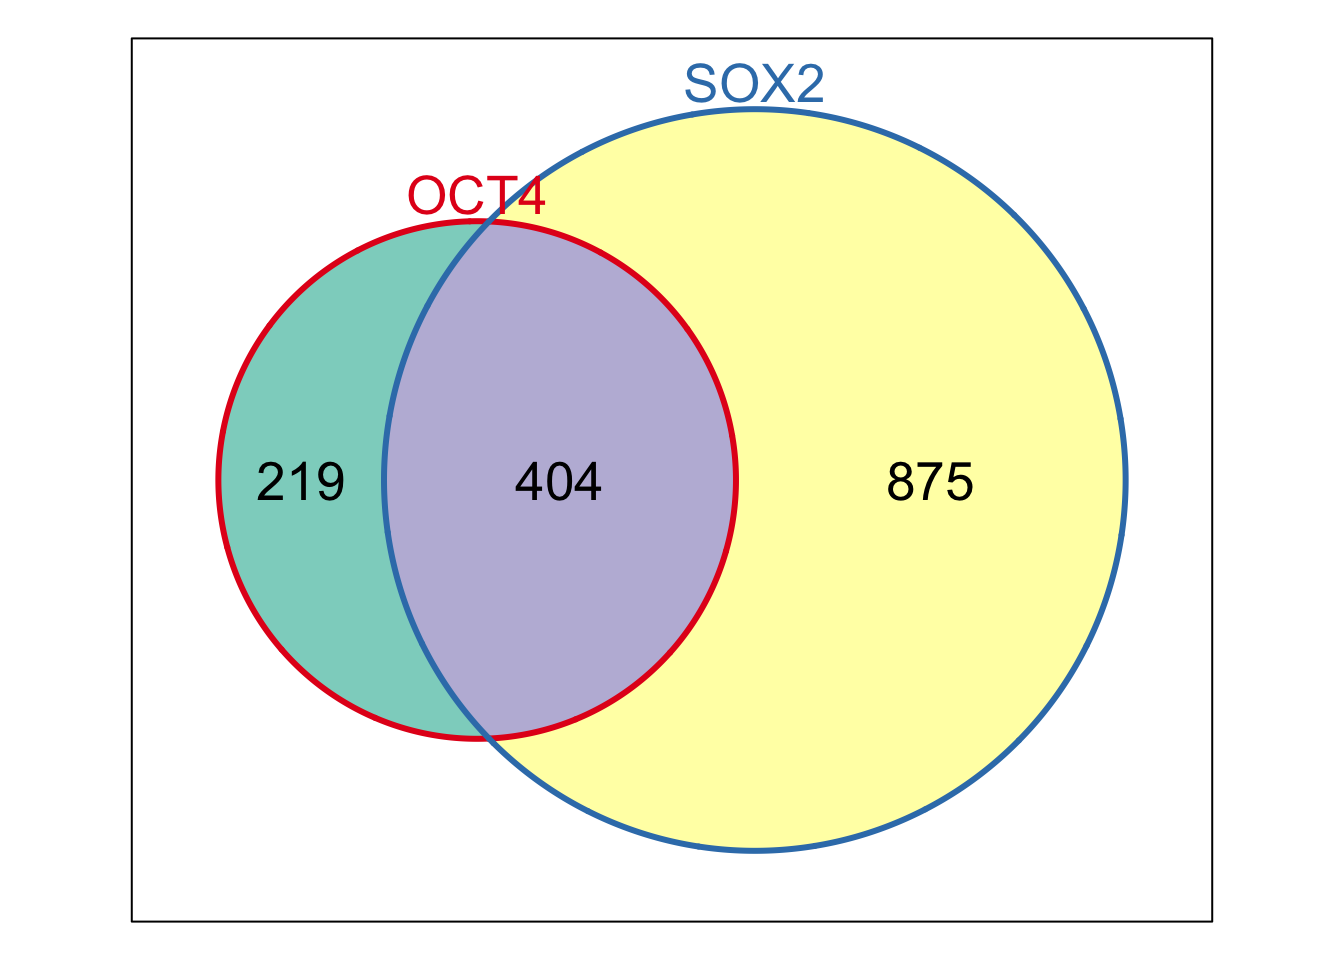
data(StemCell)
w <- Venn(Sets=StemCell[1:2])
Weights(w)
##  00  10  01  11
##   0 219 875 404
plot(w)
Weights(w) <- 1:4
plot(w)