# ===================== 工作流程说明 =====================
# 本代码演示如何使用Quantstrat进行信号有效性分析,通过扫描RSI参数评估超卖信号(RSI<30)的未来收益表现

# ===================== 包加载与初始化 =====================
# 加载所需R包
require(iterators)       # 迭代器工具(用于参数扫描循环)
## Loading required package: iteratorsrequire(quantstrat) # 量化策略框架核心包## Loading required package: quantstrat## Loading required package: quantmod## Loading required package: xts## Loading required package: zoo##
## Attaching package: 'zoo'## The following objects are masked from 'package:base':
##
## as.Date, as.Date.numeric## Loading required package: TTR## Registered S3 method overwritten by 'quantmod':
## method from
## as.zoo.data.frame zoo## Loading required package: blotter## Loading required package: FinancialInstrument## Loading required package: PerformanceAnalytics##
## Attaching package: 'PerformanceAnalytics'## The following object is masked from 'package:graphics':
##
## legend## Loading required package: foreachrequire(gamlss.util) # 统计分布可视化工具(用于箱线图)## Loading required package: gamlss.util## Loading required package: gamlss.dist##
## Attaching package: 'gamlss.dist'## The following object is masked from 'package:TTR':
##
## DPO## Loading required package: gamlss## Loading required package: splines## Loading required package: gamlss.data##
## Attaching package: 'gamlss.data'## The following object is masked from 'package:datasets':
##
## sleep## Loading required package: nlme## Loading required package: parallel## ********** GAMLSS Version 5.4-22 **********## For more on GAMLSS look at https://www.gamlss.com/## Type gamlssNews() to see new features/changes/bug fixes.# 清理策略环境残留数据(防止旧数据干扰)
suppressWarnings(rm("order_book.RSI", pos = .strategy)) # 删除策略订单记录
suppressWarnings(rm("account.RSI", "portfolio.RSI", pos = .blotter)) # 删除账户组合记录
suppressWarnings(rm("account.st", "portfolio.st", "stock.str", "stratRSI", "startDate", "initEq", 'start_t', 'end_t')) # 清除临时变量
# ===================== 参数设置 =====================
n = 2 # RSI指标的默认计算周期(日)
# ===================== 数据准备阶段 =====================
# 设置货币类型和交易标的
currency("USD") # 设置基础货币为美元## [1] "USD"currency("EUR") # 其他货币类型(示例用)## [1] "EUR"symbols = c("SPY") # 交易标的为标普500 ETF
# 初始化金融工具并下载历史数据
for(symbol in symbols){
stock(symbol, currency = "USD", multiplier = 1) # 定义标的属性(货币/乘数)
getSymbols(symbol, src = 'yahoo') # 从雅虎财经下载OHLC数据
}
# ===================== 账户/组合/策略初始化 =====================
stratRSI <- strategy("RSI") # 创建策略对象
# 回测参数设置
startDate = '1997-12-31' # 回测起始日期
initEq = 100000 # 初始资金10万美元
port.st <- 'RSI' # 组合命名(便于参数调整后重复运行)
# 初始化组合、账户和订单系统
initPortf(port.st, symbols = symbols) # 创建投资组合对象## [1] "RSI"initAcct(port.st, portfolios = port.st, initEq = initEq) # 创建账户对象## [1] "RSI"initOrders(portfolio = port.st) # 初始化订单簿
# 设置头寸限制规则(风险控制)
for(symbol in symbols){
# 参数说明:组合名称, 标的, 生效日, 最大持仓量, 最大交易次数
addPosLimit(port.st, symbol, startDate, 300, 3)
}
# ===================== 技术指标配置 =====================
# 添加RSI指标到策略中
stratRSI <- add.indicator(
strategy = stratRSI,
name = "RSI", # 使用TTR包的RSI函数
arguments = list(
price = quote(getPrice(mktdata)), # 使用收盘价计算
n = n # RSI计算周期
),
label = "RSI" # 指标标签(用于后续信号引用)
)
# ===================== 交易信号定义 =====================
# 信号1:RSI上穿70(超买信号)
stratRSI <- add.signal(
strategy = stratRSI,
name = "sigThreshold", # 阈值型信号生成器
arguments = list(
threshold = 70, # 阈值水平
column = "RSI", # 作用于RSI指标列
relationship = "gt", # 大于关系(greater than)
cross = TRUE # 需要穿越阈值(避免持续触发)
),
label = "RSI.gt.70" # 信号标签
)
# 信号2:RSI下穿30(超卖信号)
stratRSI <- add.signal(
strategy = stratRSI,
name = "sigThreshold",
arguments = list(
threshold = 30, # 阈值水平
column = "RSI",
relationship = "lt", # 小于关系(less than)
cross = TRUE
),
label = "RSI.lt.30" # 信号标签
)
# ===================== 信号分析模块 =====================
signal.label = 'RSI.lt.30' # 选择分析的信号(此处分析超卖信号)
.n = seq(2, 10, 1) # 创建RSI参数的扫描范围(2到10日,步长1)
# 将参数扫描配置添加到策略对象
strategy.st <- add.distribution(
stratRSI,
paramset.label = 'RSI', # 参数集名称
component.type = 'indicator', # 组件类型(指标)
component.label = 'RSI', # 对应指标标签
variable = list(n = .n), # 要扫描的参数变量(n值)
label = 'nRSI' # 参数集标签
)
# ===================== 执行参数研究 =====================
results <- apply.paramset.signal.analysis(
strategy.st, # 策略对象
paramset.label = 'RSI', # 参数集标签
port.st, # 组合名称
sigcol = signal.label, # 分析的目标信号列
sigval = 1, # 信号触发值(1=激活状态)
on = NULL, # 分析频率(NULL表示事件驱动)
forward.days = 10, # 向前分析天数(信号触发后10日)
cum.sum = TRUE, # 计算累计收益
include.day.of.signal = F, # 排除信号触发当日
obj.fun = signal.obj.slope, # 目标函数(收益曲线斜率)
decreasing = T, # 结果降序排列
mktdata = NULL, # 使用默认市场数据
verbose = TRUE # 显示详细运行信息
)## Applying Parameter Set: 2
## Applying Parameter Set: 3
## Applying Parameter Set: 4
## Applying Parameter Set: 5
## Applying Parameter Set: 6
## Applying Parameter Set: 7
## Applying Parameter Set: 8
## Applying Parameter Set: 9
## Applying Parameter Set: 10# ===================== 可视化分析结果 =====================
# 绘制不同参数收益柱状图
signal.plot(
results$sigret.by.asset$SPY, # 选择SPY的信号收益数据
rows = 2, # 图形分2行显示
columns = 5 # 每行5列(共显示10个参数组合)
)
# 绘制参数集2的收益分布箱线图
distributional.boxplot(
results$sigret.by.asset$SPY$paramset.2 # 指定参数集数据
)## GAMLSS-RS iteration 1: Global Deviance = 41038.77
## GAMLSS-RS iteration 2: Global Deviance = 41038.77## gamlss package currently doesnt
## support encapsulation of their
## plotting function. Pending Patch.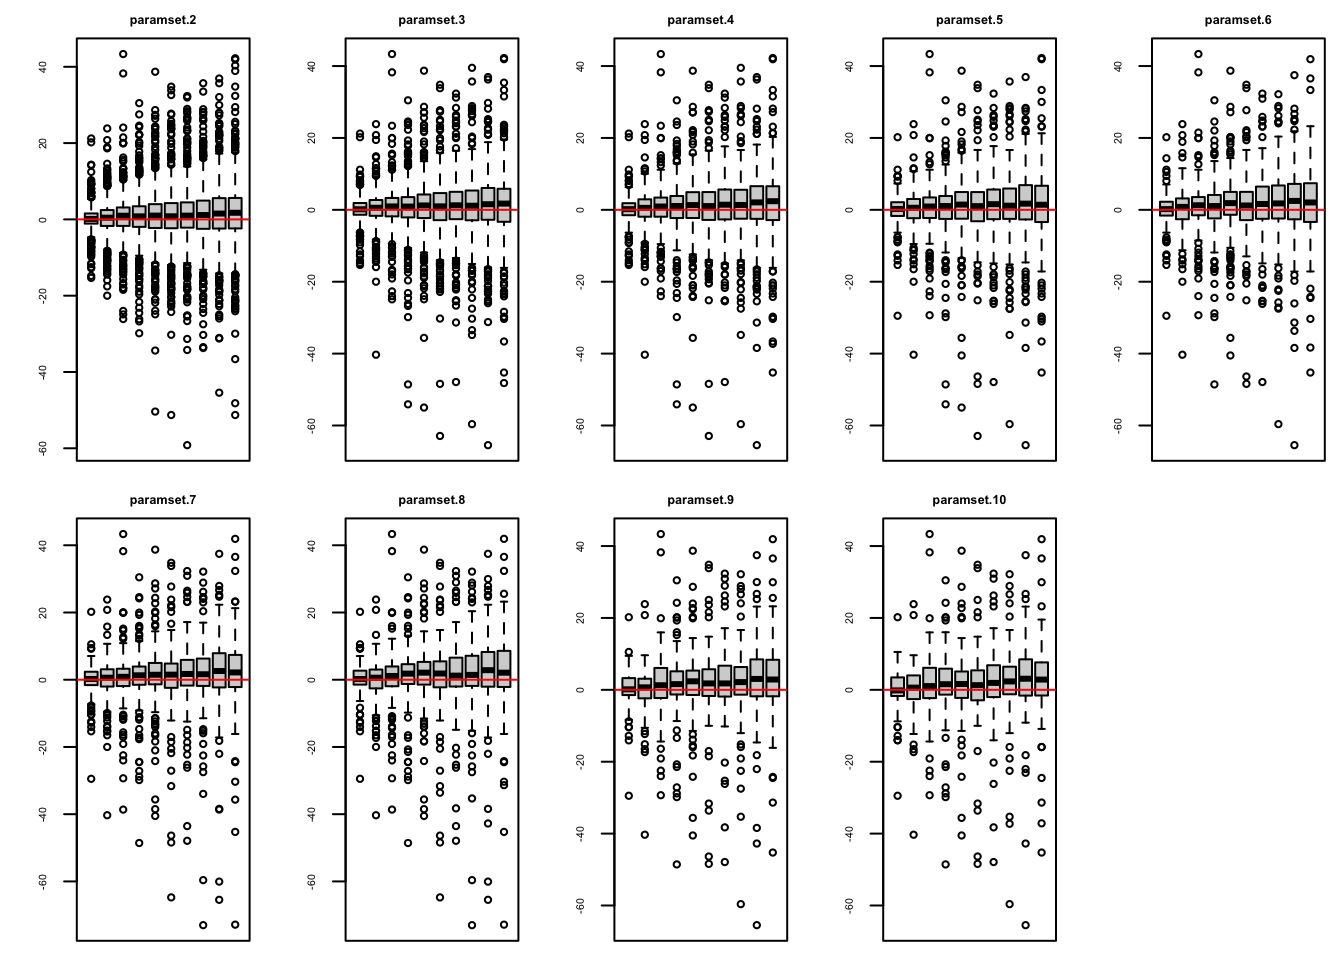
核心逻辑流程图解
graph TD A[环境初始化] –> B[加载历史数据] B –> C[定义RSI策略] C –> D[设置信号规则] D –> E[参数扫描配置] E –> F[执行信号分析] F –> G[可视化收益表现]
##关键参数说明表
参数 含义 推荐调整方法 forward.days=10 信号触发后跟踪天数 根据策略持仓周期调整 n=seq(2,10,1) RSI参数扫描范围 扩大范围可探索更多可能性 threshold=30/70 超买超卖阈值 根据资产波动性调整 obj.fun=slope 优化目标函数(收益曲线斜率) 可改为夏普比率等指标
代码运行结果解读
- 柱状图:展示不同RSI参数对应的10日累计收益,柱体越高表示该参数效果越好
- 箱线图:显示特定参数下收益的分布情况,箱体越紧凑说明策略稳定性越高
建议优先选择 高收益柱体且箱线图波动小的参数组合作为最终策略参数。可通过修改.n序列扩大参数扫描范围,例如seq(5,20,5)测试更长周期的RSI效果。