配对交易是一种基于统计套利的量化策略,其核心逻辑是通过识别价格走势高度相关的两只股票,当它们的价格偏离历史正常关系时建立对冲头寸,等待关系回归时获利。
本文将解析一段基于 R 语言 quantstrat 包的配对交易策略代码,展示其实现思路与核心意义。
策略核心逻辑与代码框架
这段代码以 SPY 和 DIA 两只 ETF 为交易标的,通过构建价格比率的均值回归模型实现配对交易。策略的核心步骤包括:数据同步与准备、策略环境初始化、指标与信号构建、自定义订单规模控制、交易规则设置,以及回测与绩效分析。
以下是完整代码实现:
# Kindly contributed to quantstrat by Garrett See
# code borrowed heavily from existing quantstrat demos

# 这是一个简单的配对交易示例,旨在展示如何扩展现有 quantstrat 功能。
# 它使用 addPosLimits 指定头寸水平和限制,并演示如何将自定义订单规模函数传递给 osFUN

# 注意:先构建价差并将其视为单一工具,比处理股票组合更简单

## 给定两只股票,计算其名义价值比率。如果比率低于 2 标准差区间,
# 当它回升穿过区间时,买入股票 1 并卖出股票 2。如果比率高于 2 标准差区间,
# 当它回落穿过区间时,卖出股票 1 并买入股票 2。如果比率穿过其移动平均线,则平仓所有头寸。

# 股票 A 的买入(卖出)数量 = MaxPos / lvls
# 股票 B 的卖出(买入)数量 = MaxPos * 比率 / lvls

require(quantstrat)
## Loading required package: quantstrat## Loading required package: quantmod## Loading required package: xts## Loading required package: zoo##
## Attaching package: 'zoo'## The following objects are masked from 'package:base':
##
## as.Date, as.Date.numeric## Loading required package: TTR## Registered S3 method overwritten by 'quantmod':
## method from
## as.zoo.data.frame zoo## Loading required package: blotter## Loading required package: FinancialInstrument## Loading required package: PerformanceAnalytics##
## Attaching package: 'PerformanceAnalytics'## The following object is masked from 'package:graphics':
##
## legend## Loading required package: foreachsuppressWarnings(rm("order_book.pair1",pos=.strategy))
suppressWarnings(rm("account.pairs", "portfolio.pair1", pos=.blotter))
suppressWarnings(rm("startDate", "endDate", "startDate", "initEq", "SD", "N",
"symb1", "symb2", "portfolio1.st", "account.st",
"pairStrat", "out1"))
initDate <- '2013-12-31'
startDate <- '2014-01-01'
endDate <- '2015-05-01'
initEq <- 100000
SD <- 2 # 标准差倍数
N <- 20 # 移动平均线周期
MaxPos <- 1500 # 股票 A 的最大头寸;
# 股票 B 的最大头寸将是 max * 比率,即对股票 B 没有硬性头寸限制
lvls <- 3 # 分几步建仓;每笔订单数量 = MaxPos/lvls
symb1 <- 'SPY' # 可更改这些标的以尝试其他配对
symb2 <- 'DIA' # 如果更改,需确保头寸限制仍然合理
portfolio1.st <- 'pair1'
account.st <- 'pairs'
# 获取历史数据
getSymbols(c(symb1, symb2), from=startDate, to=endDate, adjust=TRUE) ## [1] "SPY" "DIA"# 以下函数用于确保所有标的的时间戳相同,删除其中一只股票数据缺失的行
alignSymbols <- function(symbols, env=.GlobalEnv) {
# 这是 qmao::alignSymbols() 的简化版本
if (length(symbols) < 2)
stop("必须提供至少 2 个标的")
if (any(!is.character(symbols)))
stop("标的必须是字符向量。")
ff <- get(symbols[1],env=env)
for (sym in symbols[-1]) {
tmp.sym <- get(sym,env=env)
ff <- merge(ff, tmp.sym, all=FALSE) # 只保留双方都有数据的行
}
for (sym in symbols) {
assign(sym,ff[,grep(sym, colnames(ff))], env=env) # 更新标的数据
}
symbols
}
alignSymbols(c(symb1, symb2)) # 对齐两只股票的时间戳## [1] "SPY" "DIA"# 定义金融工具
currency("USD") # 基础货币为美元## [1] "USD"stock(symb1, currency="USD", multiplier=1) # 定义股票 1 的属性## [1] "SPY"stock(symb2, currency="USD", multiplier=1) # 定义股票 2 的属性## [1] "DIA"# 初始化投资组合、账户和订单
initPortf(name=portfolio1.st, c(symb1,symb2)) # 创建包含两只股票的组合## [1] "pair1"initAcct(account.st, portfolios=portfolio1.st, initEq=initEq) # 初始化账户,初始资金 10 万美元## [1] "pairs"initOrders(portfolio=portfolio1.st) # 初始化订单簿
# osFUN 需要知道哪个标的是第一腿、哪个是第二腿,以及 MaxPos 和 lvls 的值。
# 因此,在投资组合中创建一个插槽来存储这些信息。
pair <- c(1, 2, MaxPos, lvls)
names(pair) <- c(symb1, symb2, "MaxPos", "lvls")
.blotter[[paste('portfolio', portfolio1.st, sep='.')]]$pair <- pair # 存储到组合属性中
# 按标的创建初始头寸限制和水平
# 如果 lvls=3,则允许多空各 3 次建仓。
addPosLimit(portfolio=portfolio1.st, timestamp=startDate, symbol=symb1,
maxpos=MaxPos, longlevels=lvls, minpos=-MaxPos, shortlevels=lvls)
addPosLimit(portfolio=portfolio1.st, timestamp=startDate, symbol=symb2,
maxpos=MaxPos, longlevels=lvls, minpos=-MaxPos, shortlevels=lvls)
# 创建策略对象
pairStrat <- strategy('pairStrat')
# 指标函数:计算两只股票的价格比率
calcRatio <- function(x) {
# 返回两只股票的名义收盘价比率
x1 <- get(x[1])
x2 <- get(x[2])
mult1 <- getInstrument(x[1])$multiplier # 合约乘数
mult2 <- getInstrument(x[2])$multiplier
rat <- (mult1 * Cl(x1)) / (mult2 * Cl(x2)) # 收盘价比率
colnames(rat) <- 'Ratio'
rat
}
# 用于确定入场/出场的指标:比率及其布林带
Ratio <- calcRatio(c(symb1[1], symb2[1]))
# 将对冲比率存储在投资组合中,以便订单规模函数使用。
# 在本示例中,对冲比率与 Ratio 指标相同。
.blotter[[paste('portfolio',portfolio1.st,sep='.')]]$HedgeRatio <- Ratio
# 创建获取最新对冲比率的函数
getHedgeRatio <- function(portfolio, timestamp) {
portf <- getPortfolio(portfolio)
timestamp <- format(timestamp,"%Y-%m-%d %H:%M:%S") # 格式化时间戳
# 上述行确保在使用日内数据且时间戳为午夜时,不会获取次日的最后一个值
toDate <- paste("::", timestamp, sep="")
Ratio <- last(portf$HedgeRatio[toDate]) # 获取该时间点的最新比率
as.numeric(Ratio)
}
# 添加指标:比率的布林带
pairStrat <- add.indicator(strategy=pairStrat, name = "calcRatio",
arguments=list(x=c(symb1,symb2)))
pairStrat <- add.indicator(strategy=pairStrat, name = "BBands",
arguments=list(HLC=quote(Ratio), sd=SD, n=N,
maType='SMA')) # 基于 20 日 SMA 计算布林带
# 生成信号:当比率从下方穿过下轨时买入,从上方穿过上轨时卖出,穿过中轨时平仓
pairStrat <- add.signal(strategy=pairStrat, name="sigCrossover",
arguments=list(columns=c("Ratio","up"),
relationship="lt"), # 比率 < 上轨(从上方穿过)
label="cross.up")
pairStrat <- add.signal(strategy=pairStrat, name="sigCrossover",
arguments=list(columns=c("Ratio","dn"),
relationship="gt"), # 比率 > 下轨(从下方穿过)
label="cross.dn")
pairStrat <- add.signal(strategy=pairStrat, name="sigCrossover",
arguments=list(columns=c("Ratio","mavg"),
relationship="lt"), # 比率 < 中轨(从上方穿过)
label="cross.mid.fa")
pairStrat <- add.signal(strategy=pairStrat, name="sigCrossover",
arguments=list(columns=c("Ratio","mavg"),
relationship="gt"), # 比率 > 中轨(从下方穿过)
label="cross.mid.fb")
# 自定义订单规模函数
#######################_ORDER SIZING FUNCTION_##################################
osSpreadMaxPos <- function (data, timestamp, orderqty, ordertype, orderside,
portfolio, symbol, ruletype, ..., orderprice) {
portf <- getPortfolio(portfolio)
# 检查 pair 插槽是否包含该函数所需的内容
if (!any(portf$pair == 1) && !(any(portf$pair == 2)))
stop('pair 必须包含值 1 和 2')
if (!any(names(portf$pair) == "MaxPos") || !any(names(portf$pair) == "lvls"))
stop('pair 必须包含 MaxPos 和 lvls')
if (portf$pair[symbol] == 1) legside <- "long" # 第一腿
if (portf$pair[symbol] == 2) legside <- "short" # 第二腿(与第一腿方向相反)
MaxPos <- portf$pair["MaxPos"]
lvls <- portf$pair["lvls"]
ratio <- getHedgeRatio(portfolio, timestamp) # 获取当前对冲比率
pos <- getPosQty(portfolio, symbol, timestamp) # 当前头寸
PosLimit <- getPosLimit(portfolio, symbol, timestamp) # 头寸限制
qty <- orderqty
if (legside == "short") {# 标的是第二腿
## 注释掉下一行可使每只股票的订单规模相等。
addPosLimit(portfolio=portfolio, timestamp=timestamp, symbol=symbol,
maxpos=round(MaxPos*ratio,0), longlevels=lvls,
minpos=round(-MaxPos*ratio,0), shortlevels=lvls) # 调整第二腿的头寸限制
##
qty <- -orderqty # 反转股票 B 的订单数量(多空相反)
}
if (qty > 0) orderside = 'long' # 确定订单方向
if (qty < 0) orderside = 'short'
# 调用 osMaxPos 计算符合头寸限制的订单数量
orderqty <- osMaxPos(data=data,timestamp=timestamp, orderqty=qty,
ordertype=ordertype, orderside=orderside,
portfolio=portfolio, symbol=symbol, ruletype=ruletype,
...)
# 在规则信号函数中添加订单
if (!is.null(orderqty) & !orderqty == 0 & !is.null(orderprice)) {
addOrder(portfolio=portfolio, symbol=symbol,
timestamp=timestamp, qty=orderqty, price=as.numeric(orderprice),
ordertype=ordertype, side=orderside, replace=FALSE,
status="open", ...=...)
}
return(0) # 使 ruleSignal 函数不会尝试下单
}
################################################################################
# 为多空方向创建入场和出场规则。两个标的将获得相同的买卖信号,
# 但 osMaxPos 会为第二个标的反转这些信号。
# orderqty 大于头寸限制允许的值。osMaxPos 会将订单数量调整为最大允许值的 1/3。
# (1/3 是因为我们在 PosLimit 中使用了 3 个水平)
pairStrat <- add.rule(strategy=pairStrat, name='ruleSignal',
arguments=list(sigcol="cross.dn", sigval=TRUE,
orderqty=1e6, ordertype='market',
orderside=NULL, osFUN='osSpreadMaxPos'),
type='enter') # cross.dn 信号触发入场
pairStrat <- add.rule(strategy=pairStrat, name='ruleSignal',
arguments=list(sigcol="cross.up", sigval=TRUE,
orderqty=-1e6, ordertype='market',
orderside=NULL, osFUN='osSpreadMaxPos'),
type='enter') # cross.up 信号触发入场
pairStrat <- add.rule(strategy=pairStrat, name='ruleSignal',
arguments=list(sigcol="cross.mid.fb", sigval=TRUE,
orderqty='all', ordertype='market',
orderside=NULL),
type='exit') # cross.mid.fb 信号触发出场
pairStrat <- add.rule(strategy=pairStrat, name='ruleSignal',
arguments=list(sigcol="cross.mid.fa", sigval=TRUE,
orderqty='all', ordertype='market',
orderside=NULL),
type='exit') # cross.mid.fa 信号触发出场
# 执行策略回测
out1<-applyStrategy(strategy=pairStrat, portfolios=portfolio1.st)## [1] "2014-02-04 00:00:00 DIA 500 @ 150.182621296714"
## [1] "2014-03-07 00:00:00 DIA 568 @ 160.616223229789"
## [1] "2014-03-17 00:00:00 DIA 573 @ 158.690860184405"
## [1] "2014-03-25 00:00:00 DIA -1641 @ 159.963991320726"
## [1] "2014-03-31 00:00:00 DIA -574 @ 160.796174254035"
## [1] "2014-04-22 00:00:00 DIA 574 @ 161.4743809578"
## [1] "2014-05-22 00:00:00 DIA 571 @ 162.261848260392"
## [1] "2014-06-02 00:00:00 DIA 572 @ 164.246166224292"
## [1] "2014-06-27 00:00:00 DIA 576 @ 165.51814455118"
## [1] "2014-07-02 00:00:00 DIA 27 @ 166.728744615667"
## [1] "2014-07-15 00:00:00 DIA -1746 @ 167.69330191996"
## [1] "2014-07-21 00:00:00 DIA -583 @ 167.676368799237"
## [1] "2014-07-24 00:00:00 DIA 583 @ 167.932553399241"
## [1] "2014-09-17 00:00:00 DIA -580 @ 169.355777408222"
## [1] "2014-09-24 00:00:00 DIA -584 @ 169.969729387294"
## [1] "2014-10-15 00:00:00 DIA -582 @ 159.57109738308"
## [1] "2014-10-21 00:00:00 DIA 1746 @ 164.043208292008"
## [1] "2014-10-27 00:00:00 DIA 576 @ 166.101170700567"
## [1] "2014-11-05 00:00:00 DIA -576 @ 172.700494456876"
## [1] "2014-12-03 00:00:00 DIA -586 @ 177.512433609148"
## [1] "2014-12-10 00:00:00 DIA -579 @ 173.872106214788"
## [1] "2014-12-18 00:00:00 DIA 1165 @ 176.351884195197"
## [1] "2015-01-15 00:00:00 DIA -579 @ 172.030741759151"
## [1] "2015-01-21 00:00:00 DIA 579 @ 174.456324855292"
## [1] "2015-01-29 00:00:00 DIA 578 @ 173.013702717688"
## [1] "2015-02-05 00:00:00 DIA -578 @ 177.640012837652"
## [1] "2015-04-21 00:00:00 DIA 583 @ 179.259994506836"
## [1] "2015-04-28 00:00:00 DIA 583 @ 180.839996337891"
## [1] "2014-02-04 00:00:00 SPY -500 @ 171.264049909226"
## [1] "2014-03-07 00:00:00 SPY -500 @ 183.831285747939"
## [1] "2014-03-17 00:00:00 SPY -500 @ 181.946695046646"
## [1] "2014-03-25 00:00:00 SPY 1500 @ 182.730103228311"
## [1] "2014-03-31 00:00:00 SPY 500 @ 183.416649931591"
## [1] "2014-04-22 00:00:00 SPY -500 @ 184.279745767482"
## [1] "2014-05-22 00:00:00 SPY -500 @ 185.94707775133"
## [1] "2014-06-02 00:00:00 SPY -500 @ 189.193474635518"
## [1] "2014-06-27 00:00:00 SPY -500 @ 192.977678507185"
## [1] "2014-07-15 00:00:00 SPY 1500 @ 194.367200918673"
## [1] "2014-07-21 00:00:00 SPY 500 @ 194.475604869373"
## [1] "2014-07-24 00:00:00 SPY -500 @ 195.766587803966"
## [1] "2014-09-17 00:00:00 SPY 500 @ 197.83611230376"
## [1] "2014-09-24 00:00:00 SPY 500 @ 197.582667853886"
## [1] "2014-10-15 00:00:00 SPY 500 @ 184.582760931563"
## [1] "2014-10-21 00:00:00 SPY -1500 @ 192.147074898032"
## [1] "2014-10-27 00:00:00 SPY -500 @ 194.216362617501"
## [1] "2014-11-05 00:00:00 SPY 500 @ 200.335121161983"
## [1] "2014-12-03 00:00:00 SPY 500 @ 205.830132301385"
## [1] "2014-12-10 00:00:00 SPY 500 @ 201.147003486903"
## [1] "2014-12-18 00:00:00 SPY -1000 @ 204.731130073504"
## [1] "2015-01-15 00:00:00 SPY 500 @ 198.135576473045"
## [1] "2015-01-21 00:00:00 SPY -500 @ 202.177531751319"
## [1] "2015-01-29 00:00:00 SPY -500 @ 201.092379263502"
## [1] "2015-02-05 00:00:00 SPY 500 @ 205.204015568481"
## [1] "2015-04-21 00:00:00 SPY -500 @ 209.600006103516"
## [1] "2015-04-28 00:00:00 SPY -500 @ 211.440002441406"# 更新组合和账户数据
updatePortf(Portfolio=portfolio1.st,
Dates=paste("::", as.Date(Sys.time()), sep=''))## Warning in .updatePosPL(Portfolio = pname, Symbol = as.character(symbol), :
## Could not parse ::2025-07-13 as ISO8601 string, or one/bothends of the range
## were outside the available prices: 2014-01-02/2015-04-30. Using all data
## instead.
## Warning in .updatePosPL(Portfolio = pname, Symbol = as.character(symbol), :
## Could not parse ::2025-07-13 as ISO8601 string, or one/bothends of the range
## were outside the available prices: 2014-01-02/2015-04-30. Using all data
## instead.## [1] "pair1"updateAcct(account.st, Dates=paste(startDate, endDate, sep="::")) ## [1] "pairs"updateEndEq(account.st, Dates=paste(startDate, endDate, sep="::"))## [1] "pairs"getEndEq(account.st, Sys.time()) # 查看最终权益## [1] 103576.8# 绘制持仓图表
# dev.new()
chart.Posn(Portfolio=portfolio1.st, Symbol=symb1) # 股票 1 的持仓图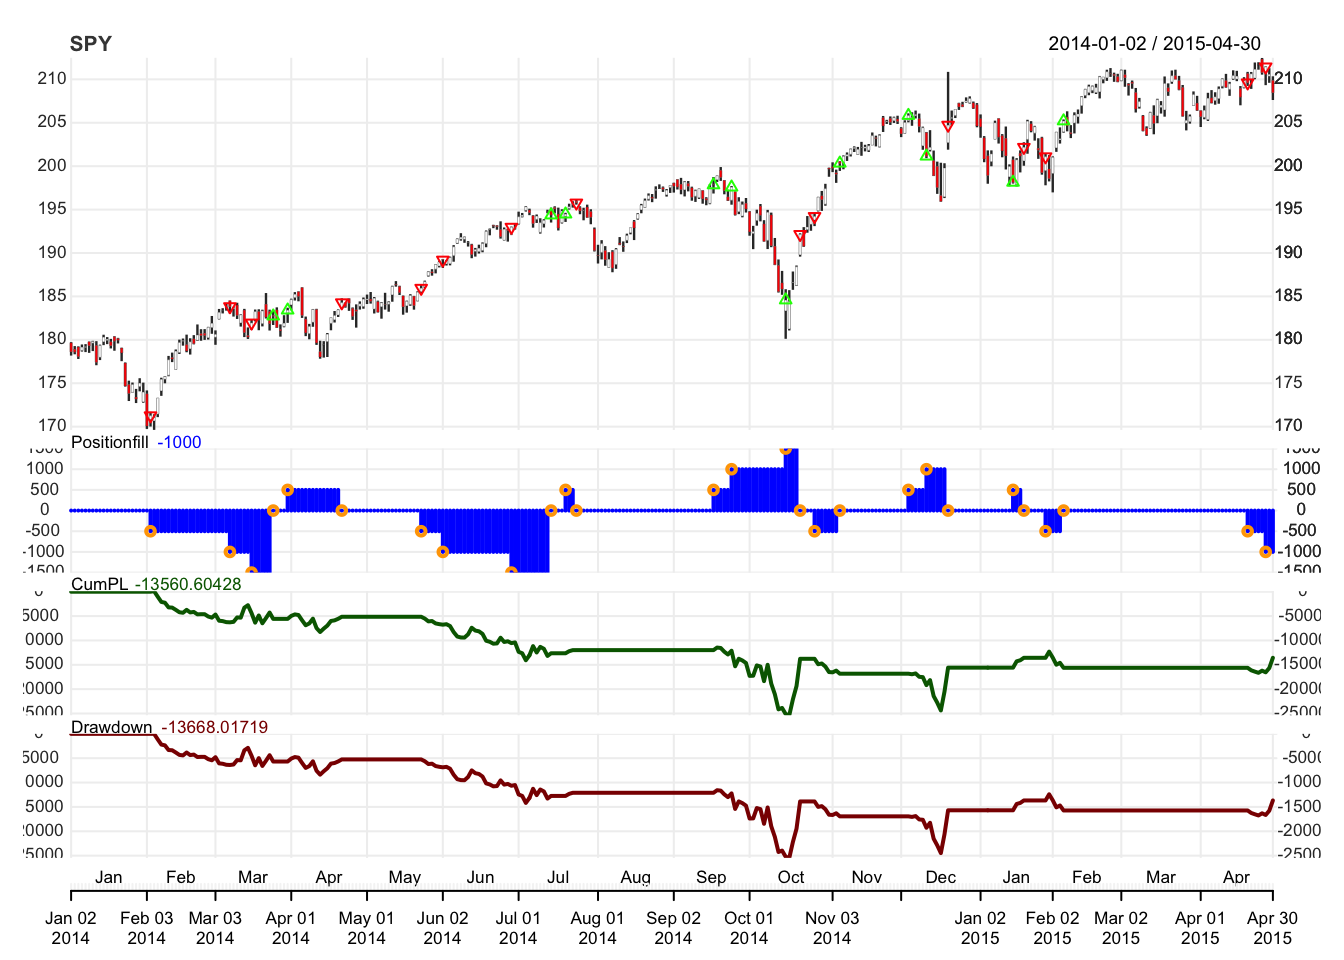
# dev.new()
chart.Posn(Portfolio=portfolio1.st, Symbol=symb2)  # 股票 2 的持仓图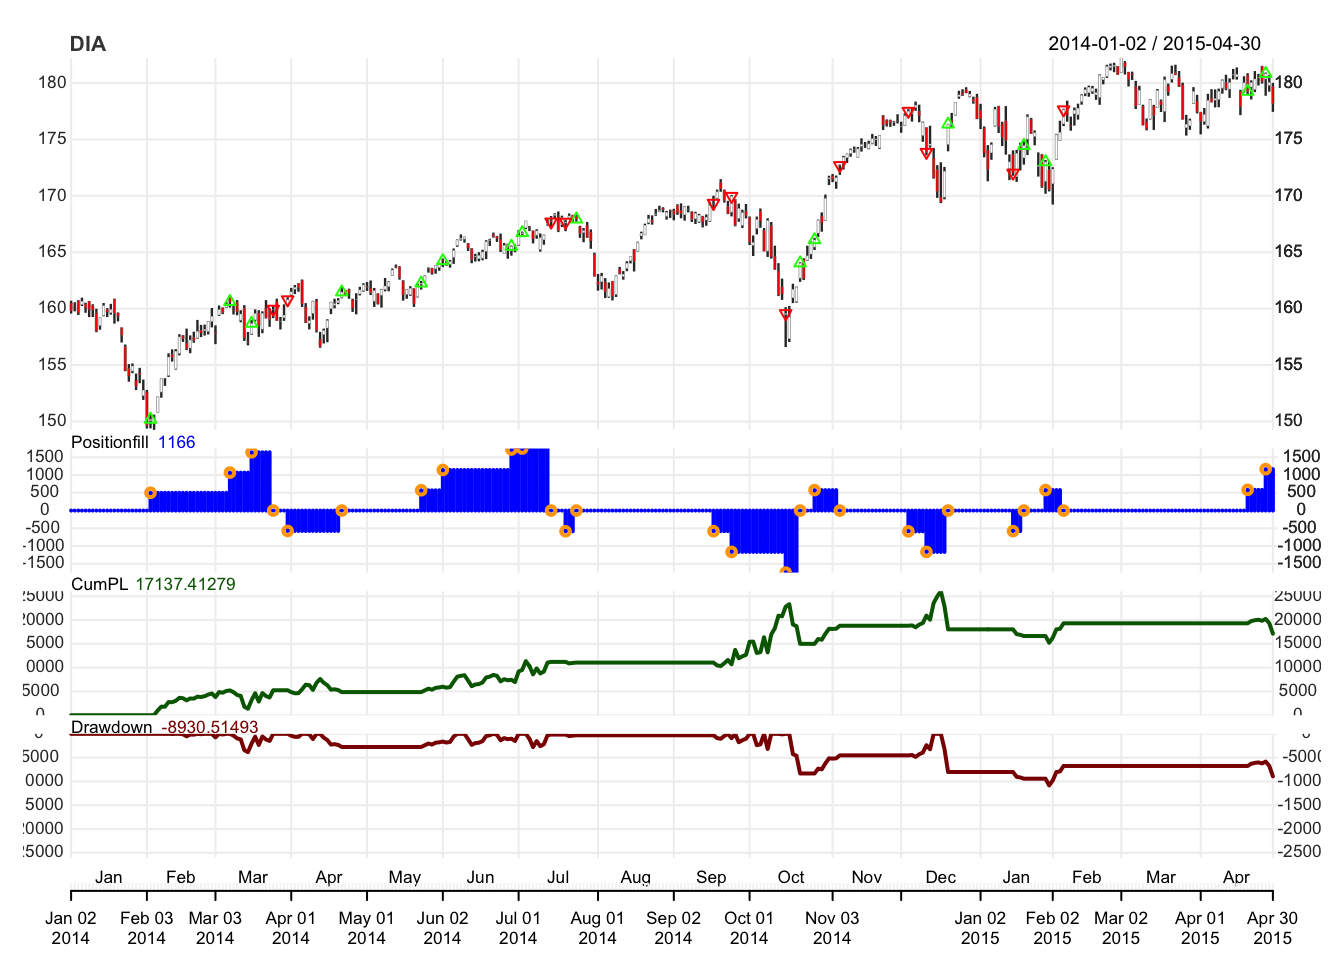
# dev.new()
chartSeries(Cl(get(symb1))/Cl(get(symb2)), TA="addBBands(n=N,sd=SD)")  # 比率与布林带图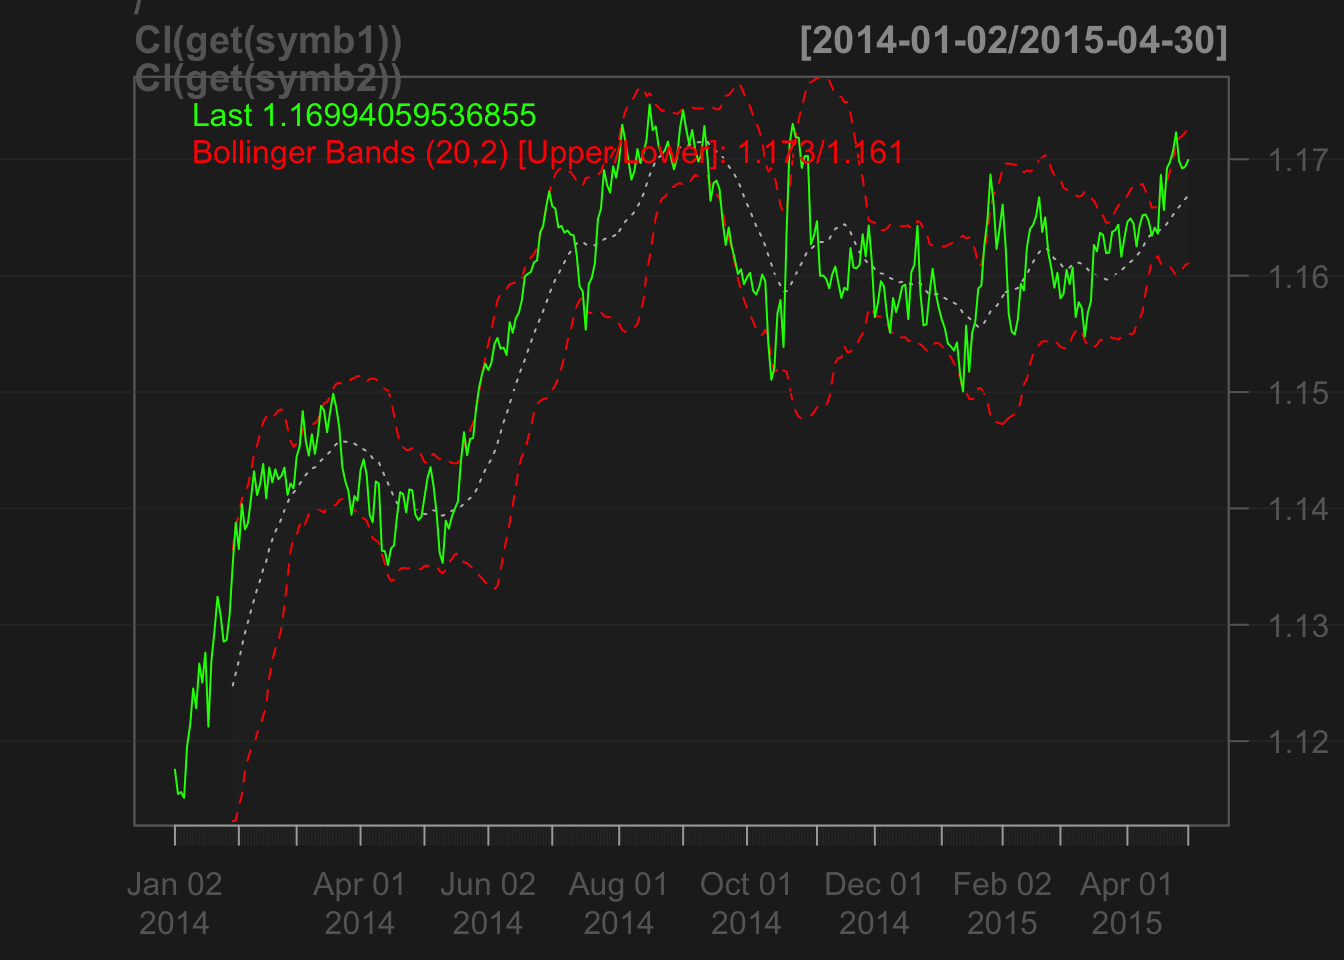
# 绩效分析
ret1 <- PortfReturns(account.st) # 组合收益
ret1$total <- rowSums(ret1) # 总收益
# 绘制绩效摘要
if("package:PerformanceAnalytics" %in% search() ||
require("PerformanceAnalytics",quietly=TRUE)) {
# dev.new()
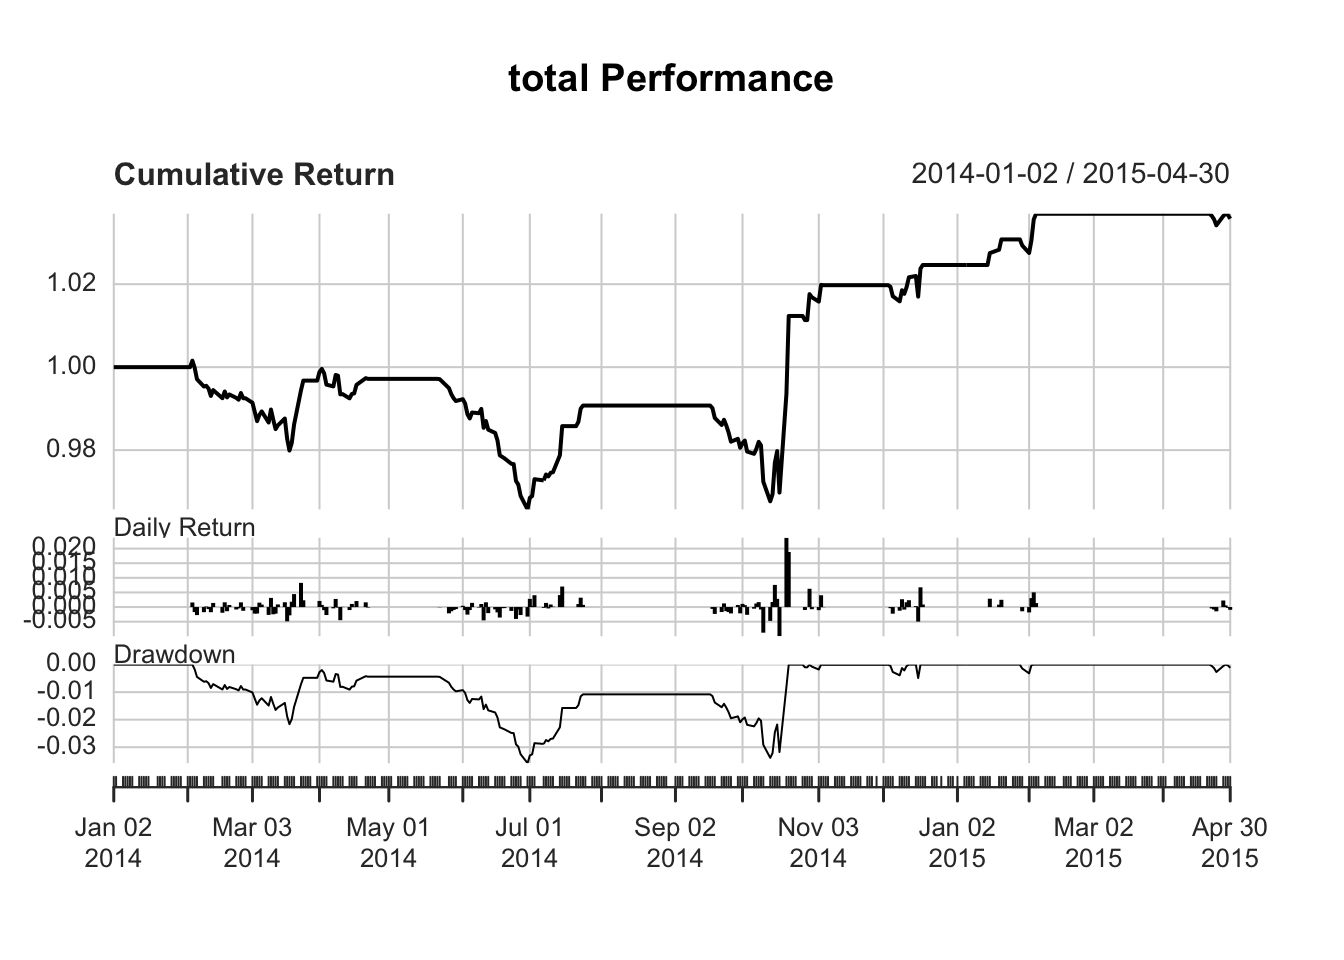
charts.PerformanceSummary(ret1$total, geometric=FALSE, wealth.index=TRUE) # 收益摘要图
}
策略实现的核心思路
这段代码的核心是通过量化手段实现配对交易的均值回归逻辑,具体可分为以下几个关键环节:
首先是数据预处理。配对交易对数据同步性要求极高,因此代码通过alignSymbols函数对齐两只股票的时间戳,删除存在数据缺失的时间点,确保价格比率的计算基于完整的共同数据。这种预处理是后续指标准确性的基础,避免因数据不同步导致的错误信号。
其次是指标与信号体系。策略的核心指标是两只股票的价格比率(由calcRatio函数计算),并通过布林带(BBands)分析该比率的波动特征。布林带由中轨(20 日移动平均线)和上下轨(中轨 ±2 倍标准差)构成,反映比率的正常波动区间。当比率从下方突破下轨(cross.dn信号)时,认为两只股票的价格偏离过大且即将回归,此时买入第一只股票、卖出第二只;当比率从上方向下突破上轨(cross.up信号)时,则反向操作;当比率回归至中轨时(cross.mid信号),平仓获利。这种基于统计偏离的信号逻辑,是均值回归策略的典型应用。
再者是头寸管理与订单规模控制。代码通过addPosLimits设置了最大头寸(MaxPos)和建仓层级(lvls),允许分 3 步建仓,避免单次入场风险过高。更关键的是自定义的osSpreadMaxPos函数,它根据两只股票的对冲比率动态调整订单数量,确保多空头寸的风险对冲平衡 —— 第一只股票的头寸为MaxPos/lvls,第二只则为其相反数乘以价格比率,使整体组合对市场系统性风险的暴露最小化。这种精细化的头寸控制,是配对交易实现风险对冲的核心。
最后是回测与绩效评估。代码通过applyStrategy执行回测,更新组合和账户数据后,利用chart.Posn展示两只股票的持仓变化,通过charts.PerformanceSummary分析策略的收益曲线、最大回撤等关键指标,全面评估策略效果。 策略的意义与价值
这段代码的意义不仅在于实现了一个可运行的配对交易策略,更展示了如何在 quantstrat 框架下扩展自定义功能:通过addPosLimits灵活设置头寸规则,借助osFUN传递自定义订单规模函数,为复杂策略的实现提供了范例。对于量化研究者而言,它演示了均值回归思想在配对交易中的具体应用 —— 通过价格比率的统计特征捕捉套利机会,同时通过多空对冲控制风险。
此外,代码也为策略优化提供了方向:例如调整布林带的周期(N)和标准差倍数(SD)以适应不同市场环境,或修改osSpreadMaxPos函数优化头寸调整逻辑。这种模块化的实现方式,使得策略易于维护和扩展,为量化交易的实践提供了有价值的参考。