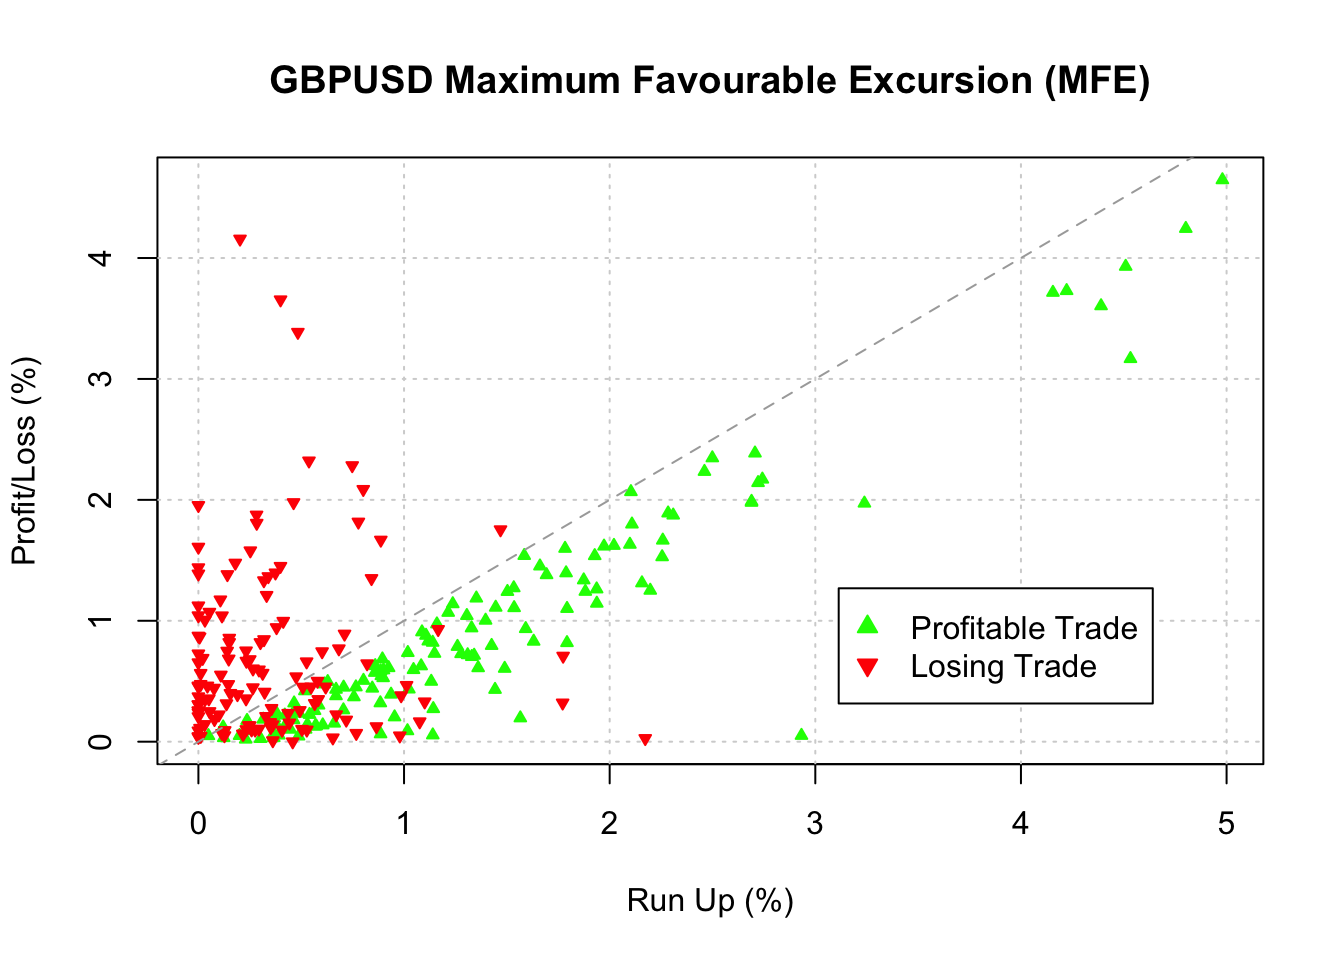
在量化交易策略评估中,最大有利波动(MFE, Maximum Favorable Excursion)是衡量单笔交易潜在盈利空间的重要指标。它代表自交易入场后,价格朝着有利方向波动的最大幅度,能直观反映策略在理想情况下的盈利捕捉能力。
通过分析 MFE,交易者可以评估当前止盈策略是否充分捕获价格波动收益,识别交易时机是否精准,甚至为动态止盈参数的设定提供依据。这段代码正是基于这一原理,通过可视化 GBPUSD 货币对的 MFE 数据,帮助交易者理解 Luxor 策略在不同交易中的盈利潜力。
# 基于Jaekle & Tamasini所著《A new approach to system development and portfolio optimisation》
#
# 图3.16:百分比形式的MFE(最大有利波动)图形

# 加载blotter包,用于交易组合的记录与绩效分析
require('blotter')
## Loading required package: blotter## Loading required package: xts## Loading required package: zoo##
## Attaching package: 'zoo'## The following objects are masked from 'package:base':
##
## as.Date, as.Date.numeric## Loading required package: FinancialInstrument## Loading required package: quantmod## Loading required package: TTR## Registered S3 method overwritten by 'quantmod':
## method from
## as.zoo.data.frame zoo## Loading required package: PerformanceAnalytics##
## Attaching package: 'PerformanceAnalytics'## The following object is masked from 'package:graphics':
##
## legend# 加载Luxor策略的交易数据(对应书中第66页的示例)
# envir=.blotter参数将数据加载到blotter包的环境中,便于后续分析
data('luxor-p066', package='quantstrat', envir=.blotter)
# 定义货币单位与汇率属性:设置交易涉及的货币及GBPUSD的最小变动单位
currency(c('GBP', 'USD')) # 定义英镑和美元为交易货币## [1] "GBP" "USD"exchange_rate(c('GBPUSD'), tick_size=0.0001) # 设置GBPUSD的最小价格变动为0.0001(即1个点)## [1] "GBPUSD"# 绘制MFE图表:以百分比形式展示每笔交易的最大有利波动
chart.ME(
Portfolio='luxor', # 指定要分析的投资组合名称
Symbol='GBPUSD', # 指定要分析的交易品种(GBPUSD货币对)
type='MFE', # 指定图表类型为MFE(最大有利波动)
scale='percent' # 指定Y轴刻度为百分比形式(相对于入场价格的波动比例)
)
为增强 MFE 分析的实用性,可引入 MFE 与最终收益的对比分析,通过散点图展示每笔交易的 MFE 与实际平仓收益的关系,识别策略在盈利兑现上的效率。可增加按时间周期(如月度、季度)的 MFE 趋势分析,探究市场环境变化对策略盈利潜力的影响。
在可视化方面,可添加阈值参考线(如 MFE 的 25%、75% 分位数),直观标记优质交易与低效交易的分界线。还可结合最大不利波动(MAE)构建风险收益比矩阵,将每笔交易映射到二维空间中,更全面评估策略的风险收益特征。通过这些改进,MFE 分析将不仅能回顾历史表现,还能为动态止盈策略、仓位管理规则的优化提供数据支持,提升策略的实战效果。