引言
技术指标是基于历史价格和成交量数据构建的分析工具,用于研判市场趋势及买卖时机。常见类型包括趋势指标(如移动平均线)、动量指标(如RSI)、波动率指标(布林带)和成交量指标(OBV)。其中,相对强弱指数(RSI)由韦尔斯·怀尔德于1978年提出,通过计算特定周期(通常14日)内平均涨幅与总波动的比值,衡量价格变化强度。其公式为:RSI = 100 - 100/(1 + 平均涨幅/平均跌幅),数值在0-100间波动。应用时,70以上视为超买信号,提示潜在回调可能;30以下为超卖信号,暗示反弹机会。进阶用法包括:观察RSI与价格背离判断趋势反转;结合趋势线突破确认交易信号;在30-70区间内运用中位线(50)判断多空力道。
需注意,在单边行情中RSI易出现钝化,应与趋势指标配合使用以提高准确性。该指标广泛应用于股票、外汇及加密货币市场的短线交易策略。
策略实现
下面我们用R实现一个基于RSI指标的量化交易策略,我们基于quantstrat包实现相关策略,完整代码及注释如下:
# ======================================================
# 量化交易策略框架搭建(基于quantstrat包)
# 策略逻辑:基于RSI指标的双向交易系统
# 核心流程:环境初始化 -> 策略定义 -> 数据准备 -> 回测执行
# ======================================================

# ---------------------------
# 1. 包加载与环境清理
# ---------------------------
# 安装必要包(已注释,按需启用)
# install.packages("devtools")
# install.packages("FinancialInstrument")
# install.packages("PerformanceAnalytics")
# devtools::install_github("braverock/blotter")
# devtools::install_github("braverock/quantstrat")

# 加载量化策略包
require(quantstrat)
## Loading required package: quantstrat
## Loading required package: quantmod
## Loading required package: xts
## Loading required package: zoo
##
## Attaching package: 'zoo'
## The following objects are masked from 'package:base':
##
##     as.Date, as.Date.numeric
## Loading required package: TTR
## Registered S3 method overwritten by 'quantmod':
##   method            from
##   as.zoo.data.frame zoo
## Loading required package: blotter
## Loading required package: FinancialInstrument
## Loading required package: PerformanceAnalytics
##
## Attaching package: 'PerformanceAnalytics'
## The following object is masked from 'package:graphics':
##
##     legend
## Loading required package: foreach
# 清理历史策略数据(避免残留数据干扰)
suppressWarnings(rm("order_book.RSI",pos=.strategy))
suppressWarnings(rm("account.RSI","portfolio.RSI",pos=.blotter))
suppressWarnings(rm("account.st",
                    "portfolio.st",
                    "stock.str",
                    "stratRSI",
                    "initDate",
                    "initEq",
                    'start_t',
                    'end_t'
                    )
                 )

# ---------------------------
# 2. 策略主体构建
# ---------------------------
# 创建策略容器
stratRSI <- strategy("RSI")
n=2  # 参数示例

# 2.1 添加技术指标
# 使用经典RSI指标(默认周期14)
stratRSI <- add.indicator(
  strategy = stratRSI,
  name = "RSI",    # 内置RSI函数
  arguments = list(price = quote(getPrice(mktdata))), # 获取价格数据
  label = "RSI"
)


# 2.2 定义交易信号
# 信号1:RSI上穿70(超买信号)
stratRSI <- add.signal(
  strategy = stratRSI,
  name = "sigThreshold",
  arguments = list(
    threshold = 70,
    column = "RSI",
    relationship = "gt",  # greater than
    cross = TRUE          # 要求穿越阈值
  ),
  label = "RSI.gt.70"
)

# 信号2:RSI下穿30(超卖信号)
stratRSI <- add.signal(
  strategy = stratRSI,
  name = "sigThreshold",
  arguments = list(
    threshold = 30,
    column = "RSI",
    relationship = "lt",  # less than
    cross = TRUE
  ),
  label = "RSI.lt.30"
)

# 2.3 设置交易规则
# 规则组1:做空规则
# 入场规则:RSI>70时建立空头仓位
stratRSI <- add.rule(
  strategy = stratRSI,
  name = 'ruleSignal',
  arguments = list(
    sigcol = "RSI.gt.70",   # 触发信号列
    sigval = TRUE,          # 信号有效值
    orderqty = -1000,       # 卖出数量
    ordertype = 'market',   # 市价单
    orderside = 'short',    # 空头方向
    pricemethod = 'market',
    replace = FALSE,        # 不替换现有订单
    osFUN = osMaxPos        # 使用最大仓位函数
  ),
  type = 'enter',           # 入场规则
  path.dep = TRUE           # 路径依赖
)

# 离场规则:RSI<30时平空仓
stratRSI <- add.rule(
  strategy = stratRSI,
  name = 'ruleSignal',
  arguments = list(
    sigcol = "RSI.lt.30",
    sigval = TRUE,
    orderqty = 'all',       # 平掉全部仓位
    ordertype = 'market',
    orderside = 'short',
    pricemethod = 'market',
    replace = FALSE
  ),
  type = 'exit',
  path.dep = TRUE
)

# 规则组2:做多规则
# 入场规则:RSI<30时建立多头仓位
stratRSI <- add.rule(
  strategy = stratRSI,
  name = 'ruleSignal',
  arguments = list(
    sigcol = "RSI.lt.30",
    sigval = TRUE,
    orderqty = 1000,        # 买入数量
    ordertype = 'market',
    orderside = 'long',     # 多头方向
    pricemethod = 'market',
    replace = FALSE,
    osFUN = osMaxPos
  ),
  type = 'enter',
  path.dep = TRUE
)

# 离场规则:RSI>70时平多仓
stratRSI <- add.rule(
  strategy = stratRSI,
  name = 'ruleSignal',
  arguments = list(
    sigcol = "RSI.gt.70",
    sigval = TRUE,
    orderqty = 'all',
    ordertype = 'market',
    orderside = 'long',
    pricemethod = 'market',
    replace = FALSE
  ),
  type = 'exit',
  path.dep = TRUE
)

# ---------------------------
# 3. 市场数据准备
# ---------------------------
# 设置基础货币

currency("USD")
## [1] "USD"
currency("EUR")
## [1] "EUR"
# 定义交易标的(美国行业ETF)
symbols = c("XLF", "XLP", "XLE", "XLY", "XLV", "XLI", "XLB", "XLK", "XLU")
# 初始化交易品种数据
for(symbol in symbols){
   # 注册金融工具
    stock(symbol, currency="USD",multiplier=1)
  # 下载历史数据(默认从Yahoo Finance)
    getSymbols(symbol)
}

# 保存数据
# 遍历所有符号
# for (symbol in symbols) {
#  # 检查对象是否存在
#  if (exists(symbol)) {
#    # 生成文件名
#    file_name <- paste0(symbol, ".rds")
#    # 保存为RDS文件
#    saveRDS(get(symbol), file = file_name)
#    # 打印保存信息
#    message("已保存: ", symbol, " -> ", file_name)
#  } else {
#    warning("对象 ", symbol, " 不存在")
#  }
#}

# 可以用类似以下方式测试:
# applySignals(strategy=stratRSI, mktdata=applyIndicators(strategy=stratRSI, mktdata=symbols[1]))

##### 在此放置演示和测试日期 #################
#
#if(isTRUE(options('in_test')$in_test))
#  # 使用测试日期
#  {initDate="2000-01-01"
#  endDate="2024-12-31"
#  } else
#  # 使用演示默认值
#  {initDate="2000-01-01"
#  endDate=Sys.Date()}

# ---------------------------
# 4. 回测系统初始化
# ---------------------------
# 设置回测参数
initDate = '2000-01-01'  # 初始化日期
initEq = 100000          # 初始资金(美元)
port.st = 'RSI'          # 组合名称

# 初始化投资组合
initPortf(port.st,
          symbols=symbols,
          initDate=initDate)
## [1] "RSI"
# 初始化账户
initAcct(port.st,
         portfolios=port.st,
         initDate=initDate,
         initEq=initEq)
## [1] "RSI"
# 初始化订单簿
initOrders(portfolio=port.st,
           initDate=initDate)

# 设置仓位限制(每个品种最大300股,最多3个品种)
for(symbol in symbols){
  addPosLimit(port.st,
              symbol,
              initDate,
              300,
              3 )
  }

print("初始化完成")
## [1] "初始化完成"
end_t<-Sys.time()
print(paste0("策略循环耗时:",end_t-start_t))
## [1] "策略循环耗时:6.13126289844513"
# 查看订单簿
#print(getOrderBook(port.st))

start_t<-Sys.time()
# 更新组合净值
updatePortf(Portfolio=port.st,Dates=paste('::',as.Date(Sys.time()),sep=''))
## Warning in .updatePosPL(Portfolio = pname, Symbol = as.character(symbol), :
## Could not parse ::2025-05-08 as ISO8601 string, or one/bothends of the range
## were outside the available prices: 2007-01-03/2025-05-07. Using all data
## instead.
## Warning in .updatePosPL(Portfolio = pname, Symbol = as.character(symbol), :
## Could not parse ::2025-05-08 as ISO8601 string, or one/bothends of the range
## were outside the available prices: 2007-01-03/2025-05-07. Using all data
## instead.
## Warning in .updatePosPL(Portfolio = pname, Symbol = as.character(symbol), :
## Could not parse ::2025-05-08 as ISO8601 string, or one/bothends of the range
## were outside the available prices: 2007-01-03/2025-05-07. Using all data
## instead.
## Warning in .updatePosPL(Portfolio = pname, Symbol = as.character(symbol), :
## Could not parse ::2025-05-08 as ISO8601 string, or one/bothends of the range
## were outside the available prices: 2007-01-03/2025-05-07. Using all data
## instead.
## Warning in .updatePosPL(Portfolio = pname, Symbol = as.character(symbol), :
## Could not parse ::2025-05-08 as ISO8601 string, or one/bothends of the range
## were outside the available prices: 2007-01-03/2025-05-07. Using all data
## instead.
## Warning in .updatePosPL(Portfolio = pname, Symbol = as.character(symbol), :
## Could not parse ::2025-05-08 as ISO8601 string, or one/bothends of the range
## were outside the available prices: 2007-01-03/2025-05-07. Using all data
## instead.
## Warning in .updatePosPL(Portfolio = pname, Symbol = as.character(symbol), :
## Could not parse ::2025-05-08 as ISO8601 string, or one/bothends of the range
## were outside the available prices: 2007-01-03/2025-05-07. Using all data
## instead.
## Warning in .updatePosPL(Portfolio = pname, Symbol = as.character(symbol), :
## Could not parse ::2025-05-08 as ISO8601 string, or one/bothends of the range
## were outside the available prices: 2007-01-03/2025-05-07. Using all data
## instead.
## Warning in .updatePosPL(Portfolio = pname, Symbol = as.character(symbol), :
## Could not parse ::2025-05-08 as ISO8601 string, or one/bothends of the range
## were outside the available prices: 2007-01-03/2025-05-07. Using all data
## instead.
## [1] "RSI"
end_t<-Sys.time()
print(paste0("更新交易账簿耗时:",end_t-start_t))
## [1] "更新交易账簿耗时:0.747688055038452"
# 临时修改quantmod图形参数
themelist<-chart_theme()
themelist$col$up.col<-'lightgreen'
themelist$col$dn.col<-'pink'
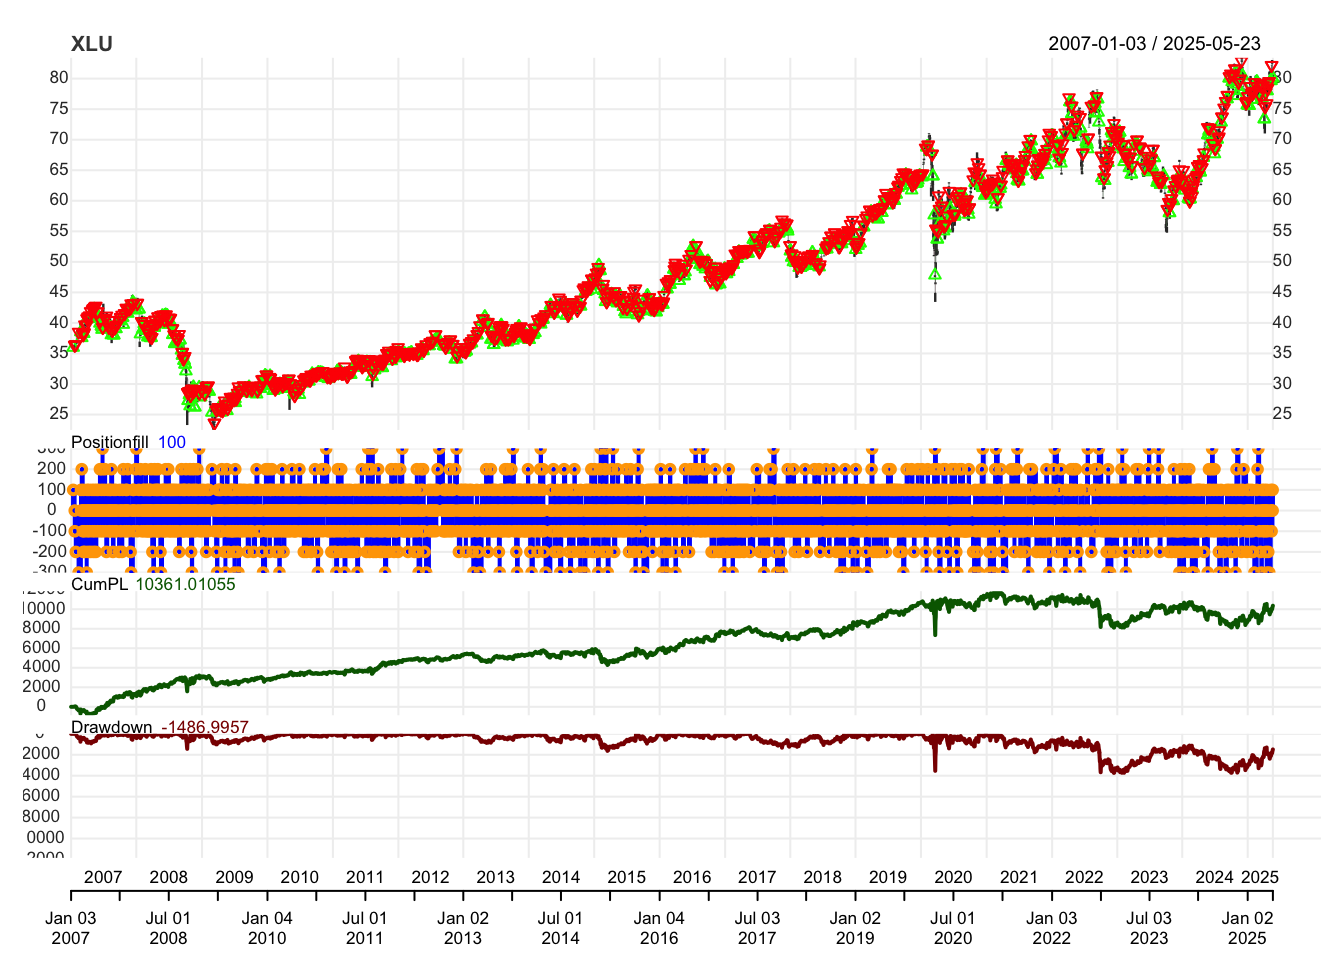
for(symbol in symbols){
# dev.new()
chart.Posn(Portfolio=port.st,Symbol=symbol,theme=themelist) # 绘制持仓图
plot(add_RSI(n=2))
print(paste0(symbol,"仓位图"))
}

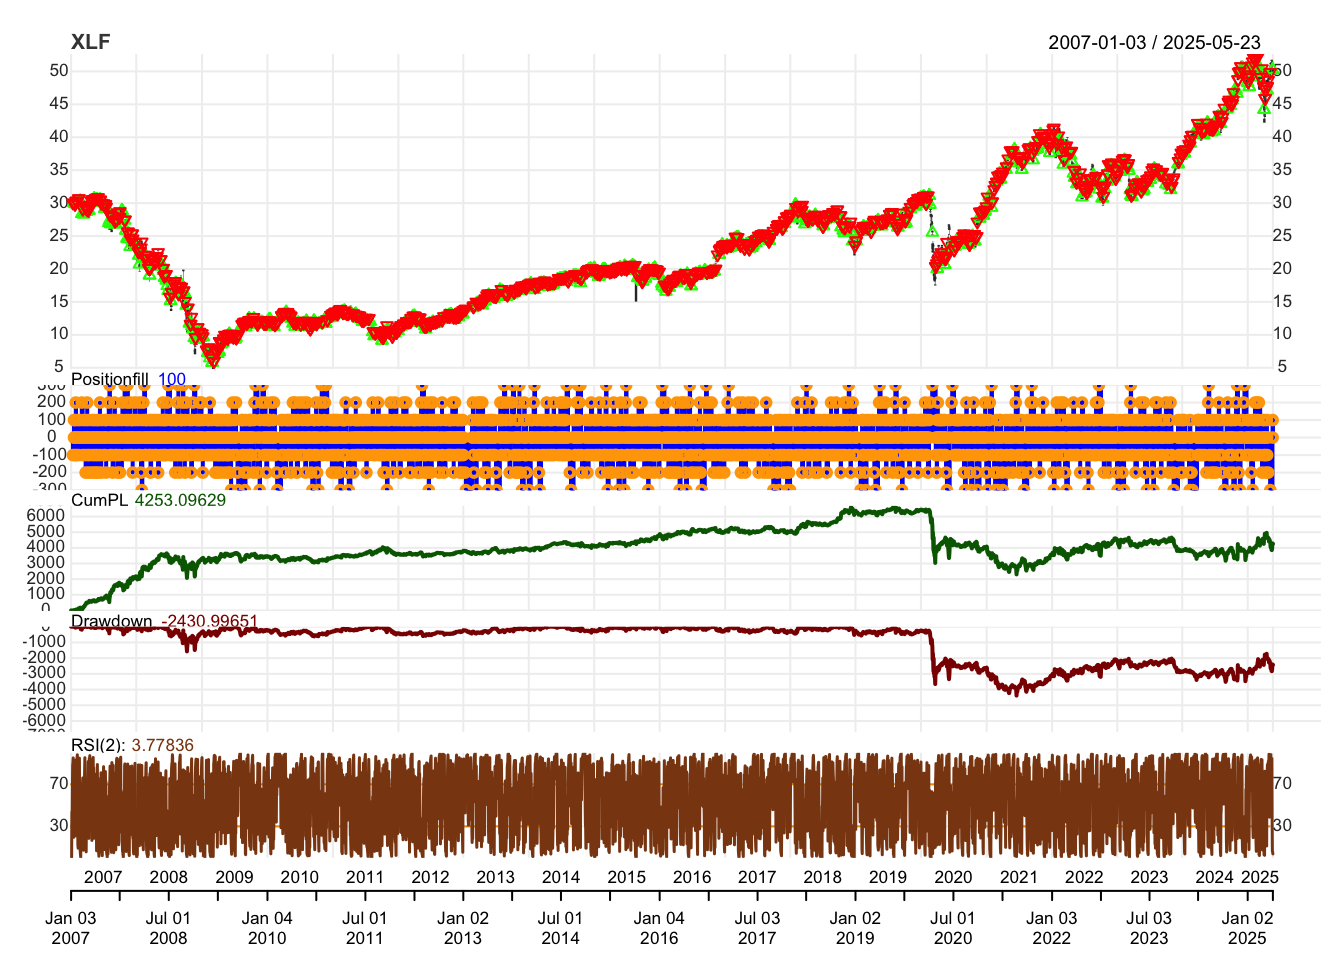
## [1] "XLF仓位图"
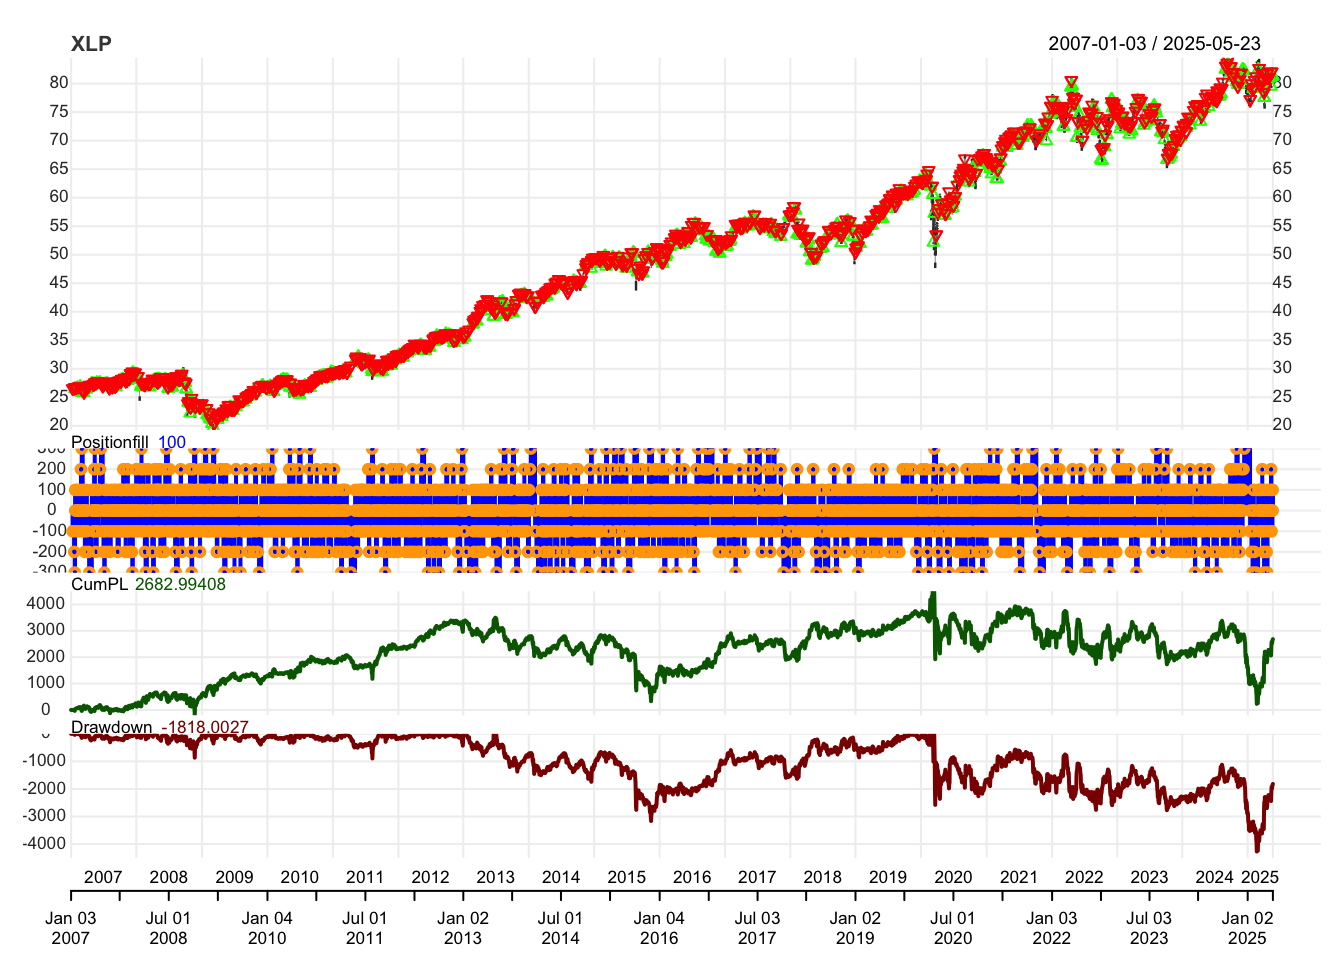
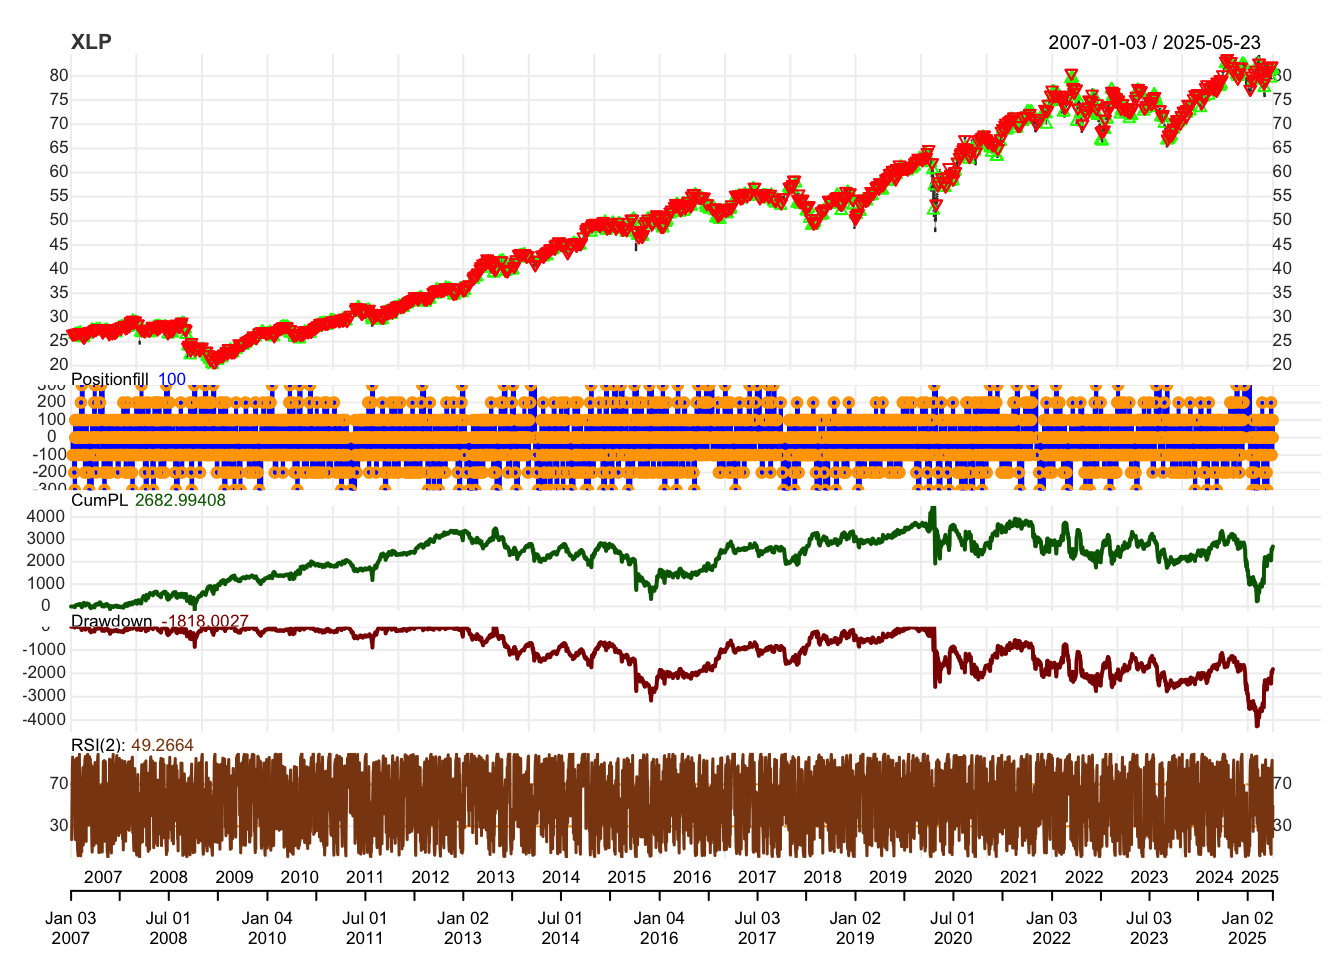
## [1] "XLP仓位图"
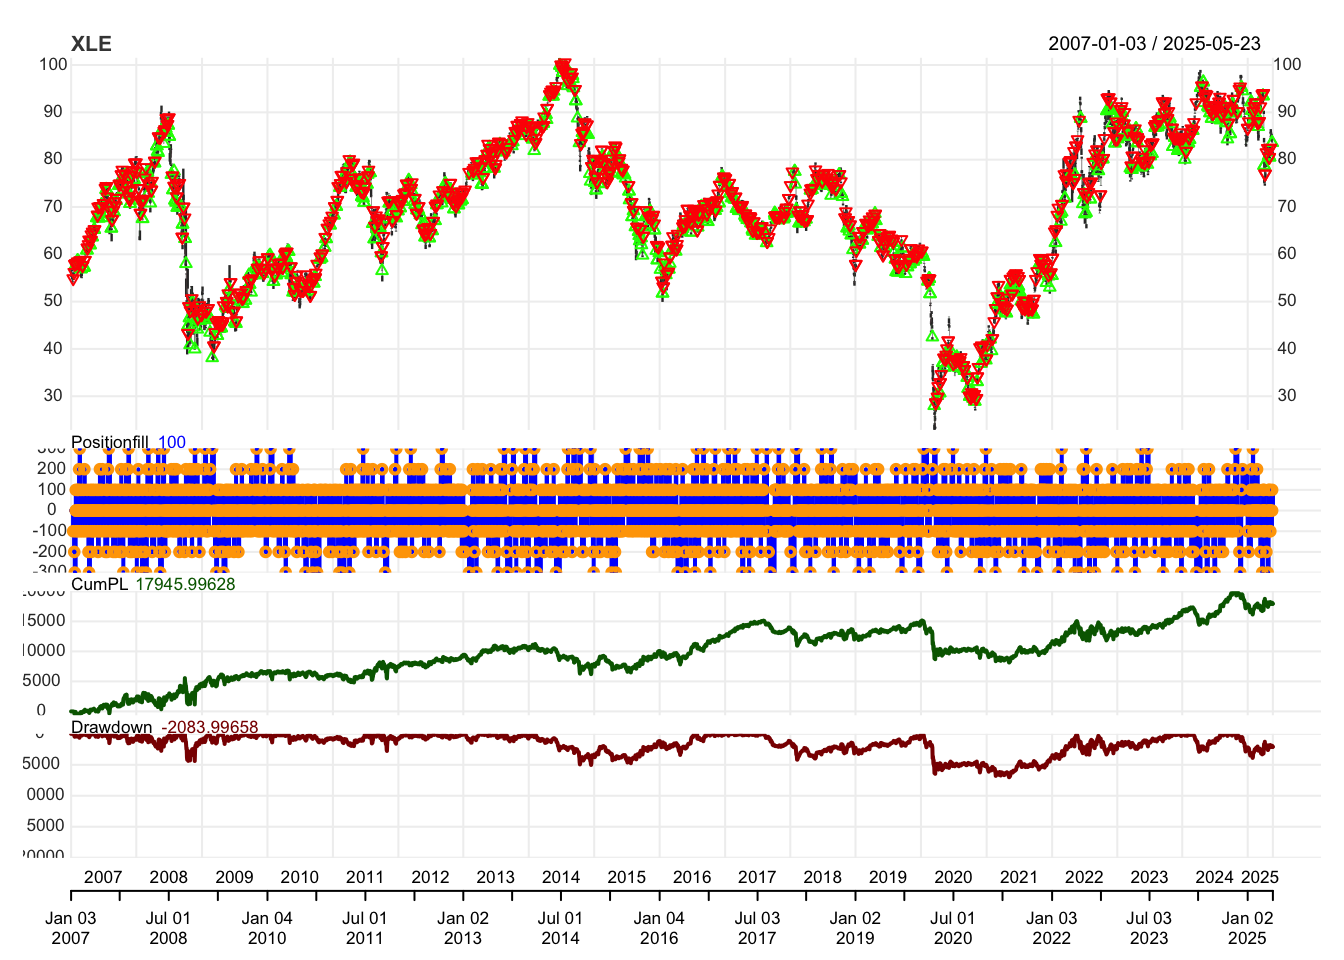
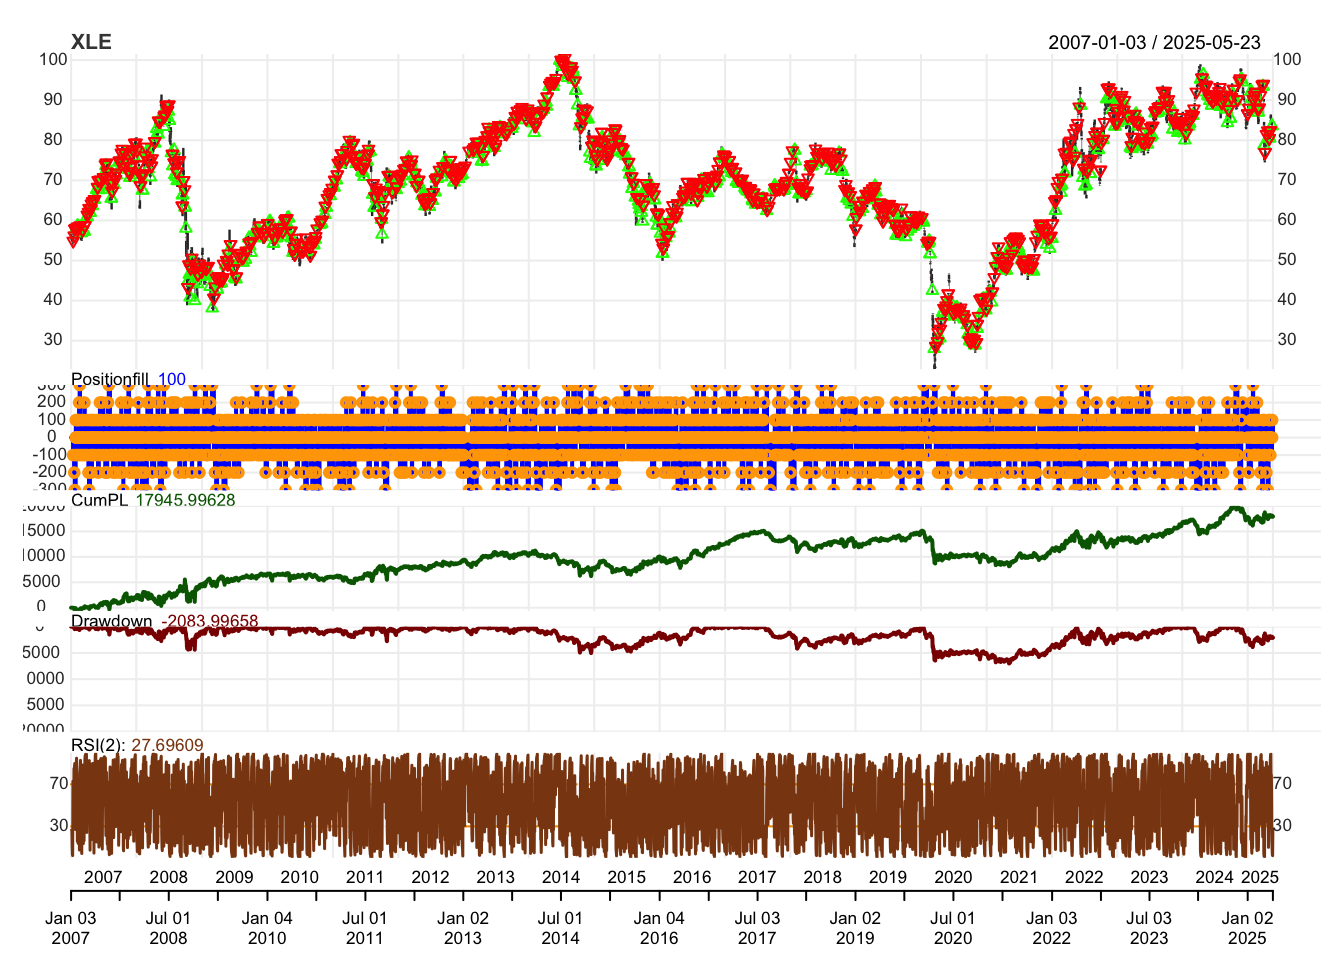
## [1] "XLE仓位图"
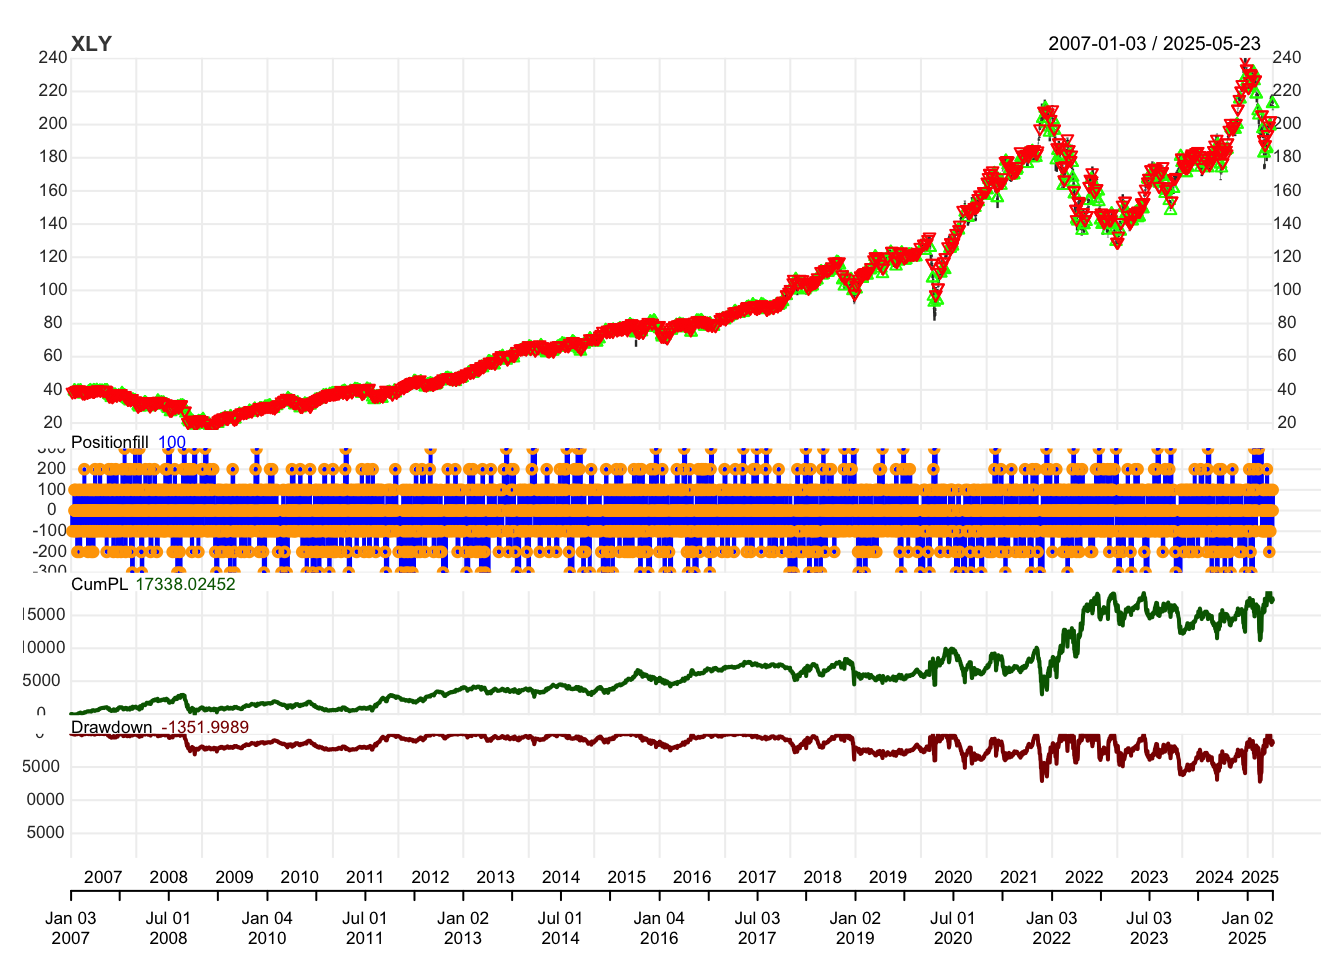
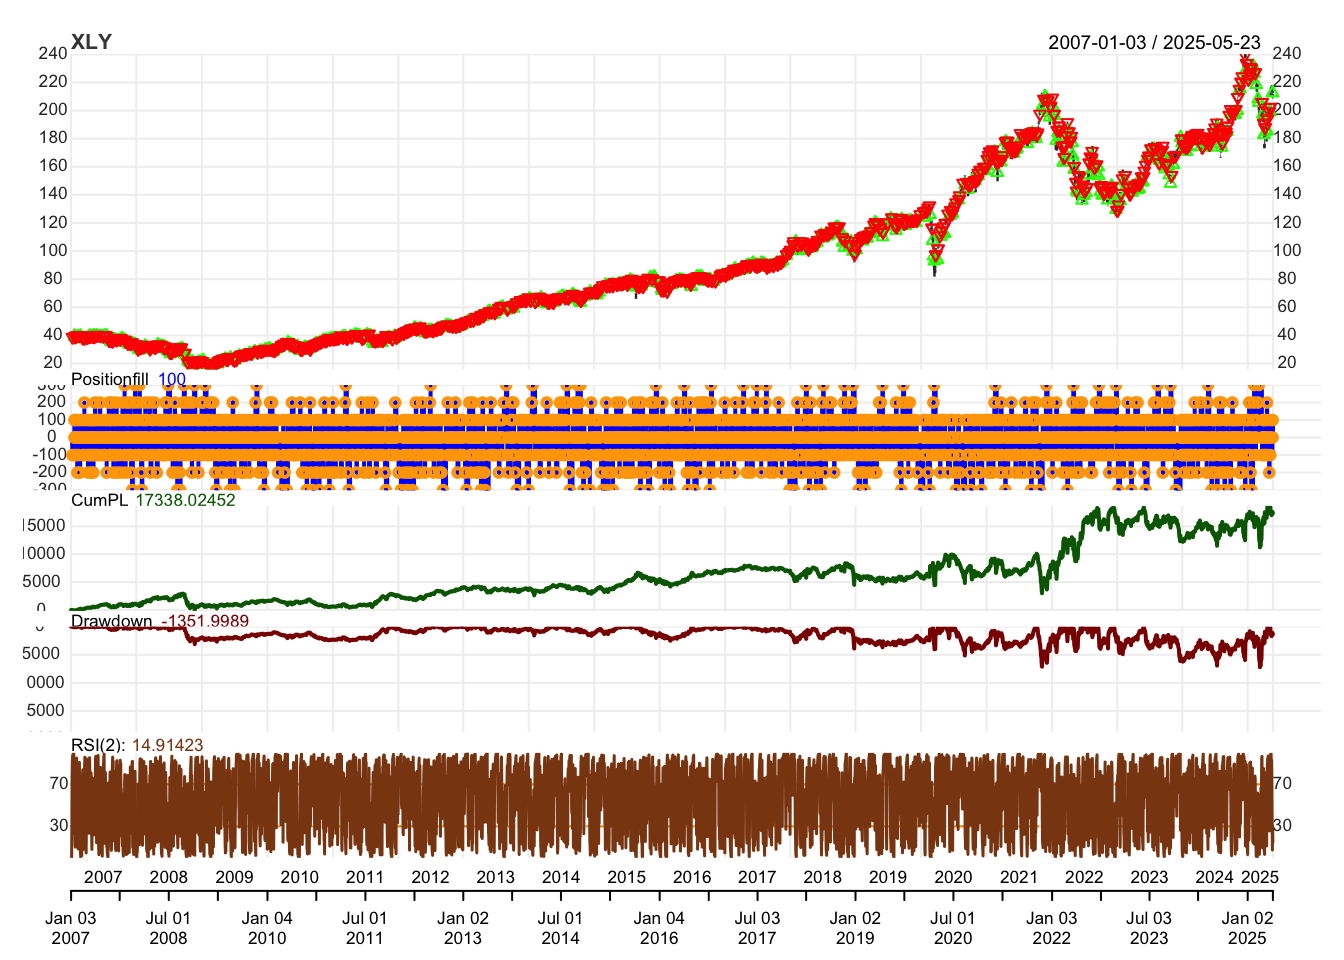
## [1] "XLY仓位图"
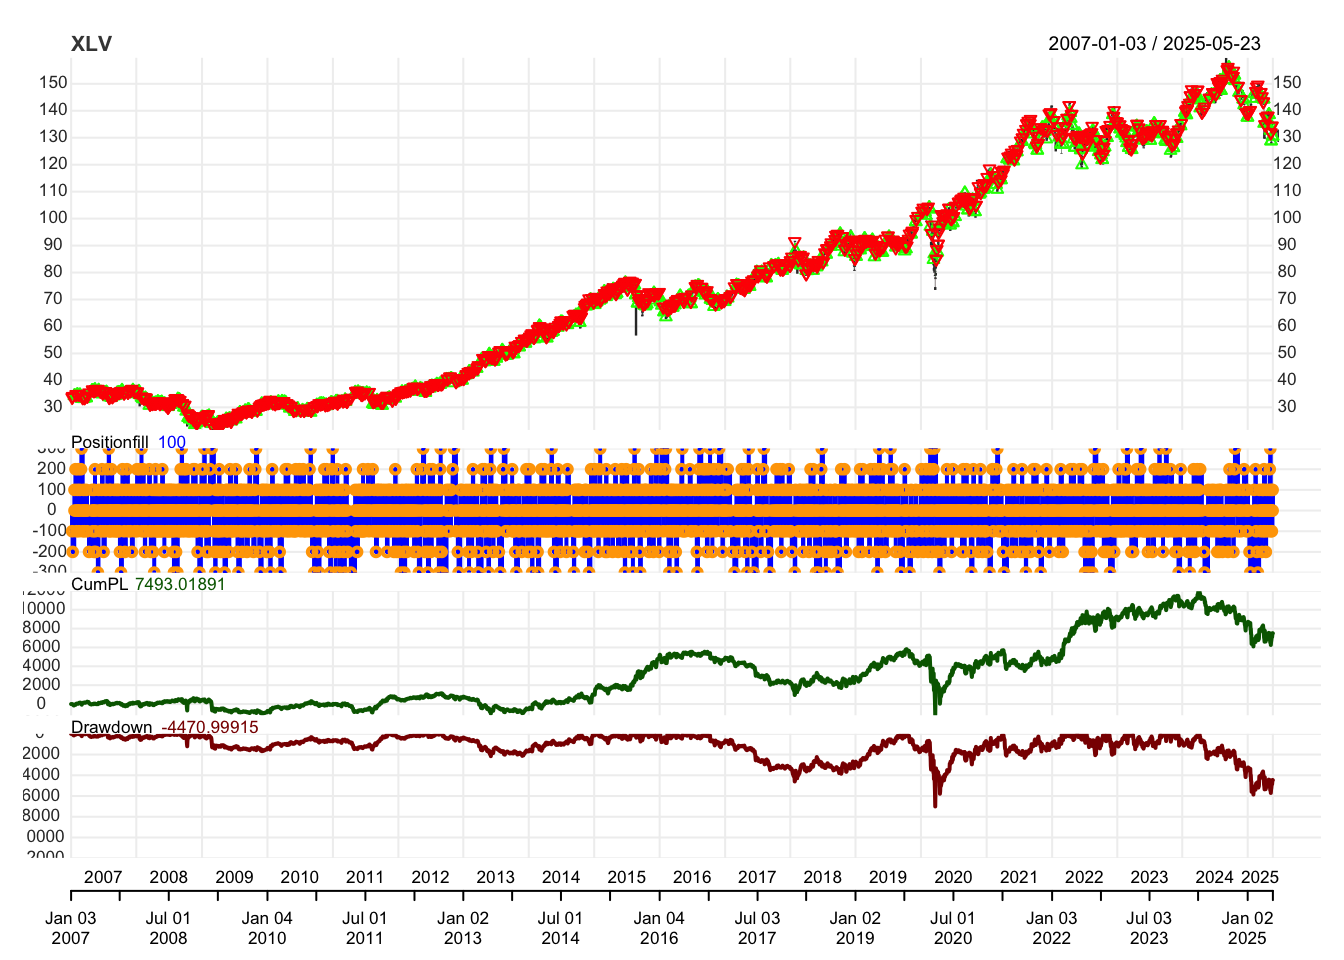
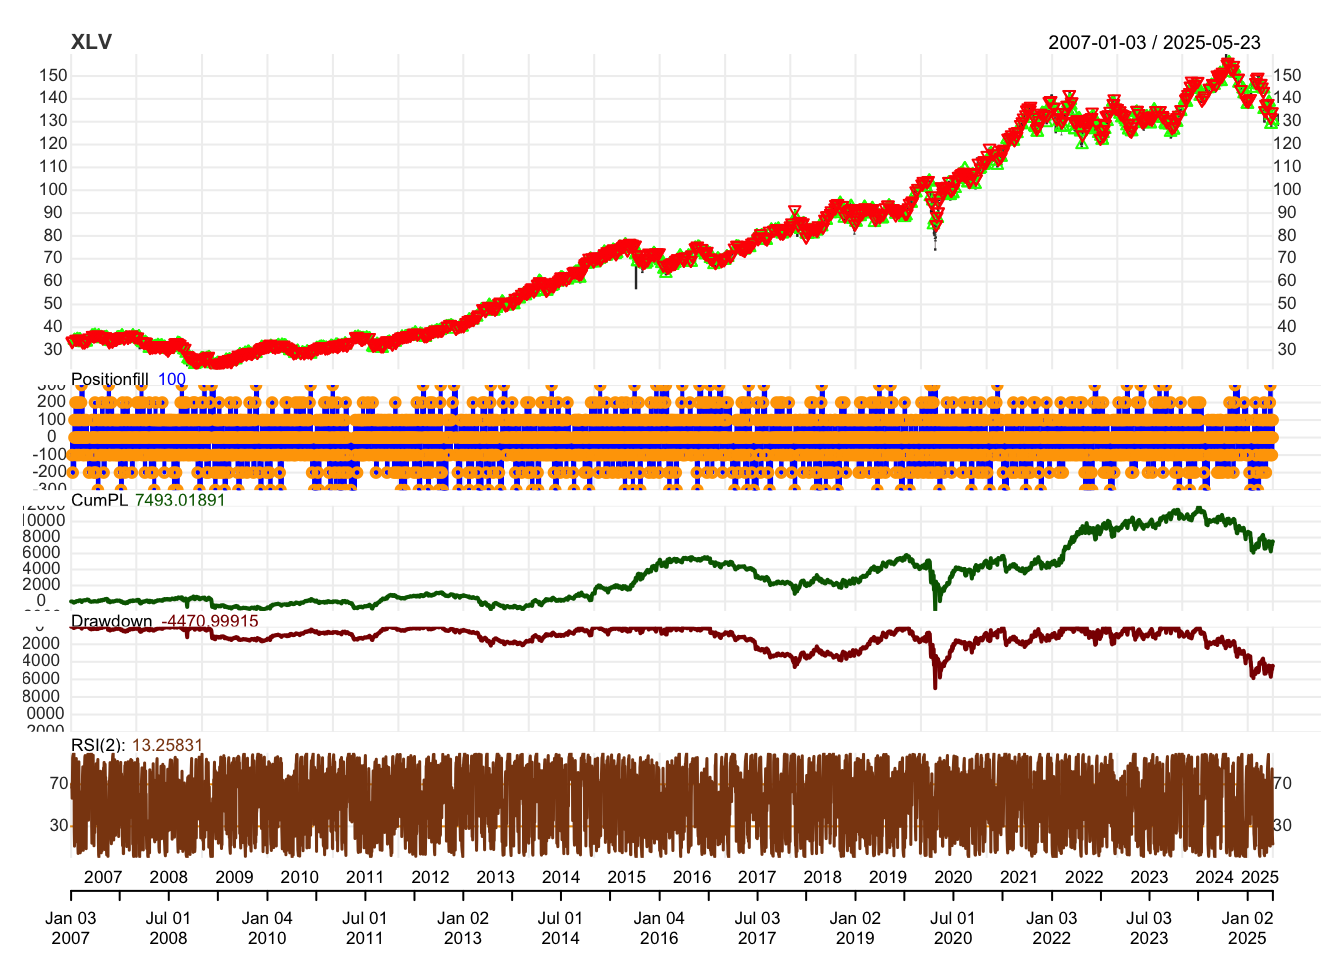
## [1] "XLV仓位图"
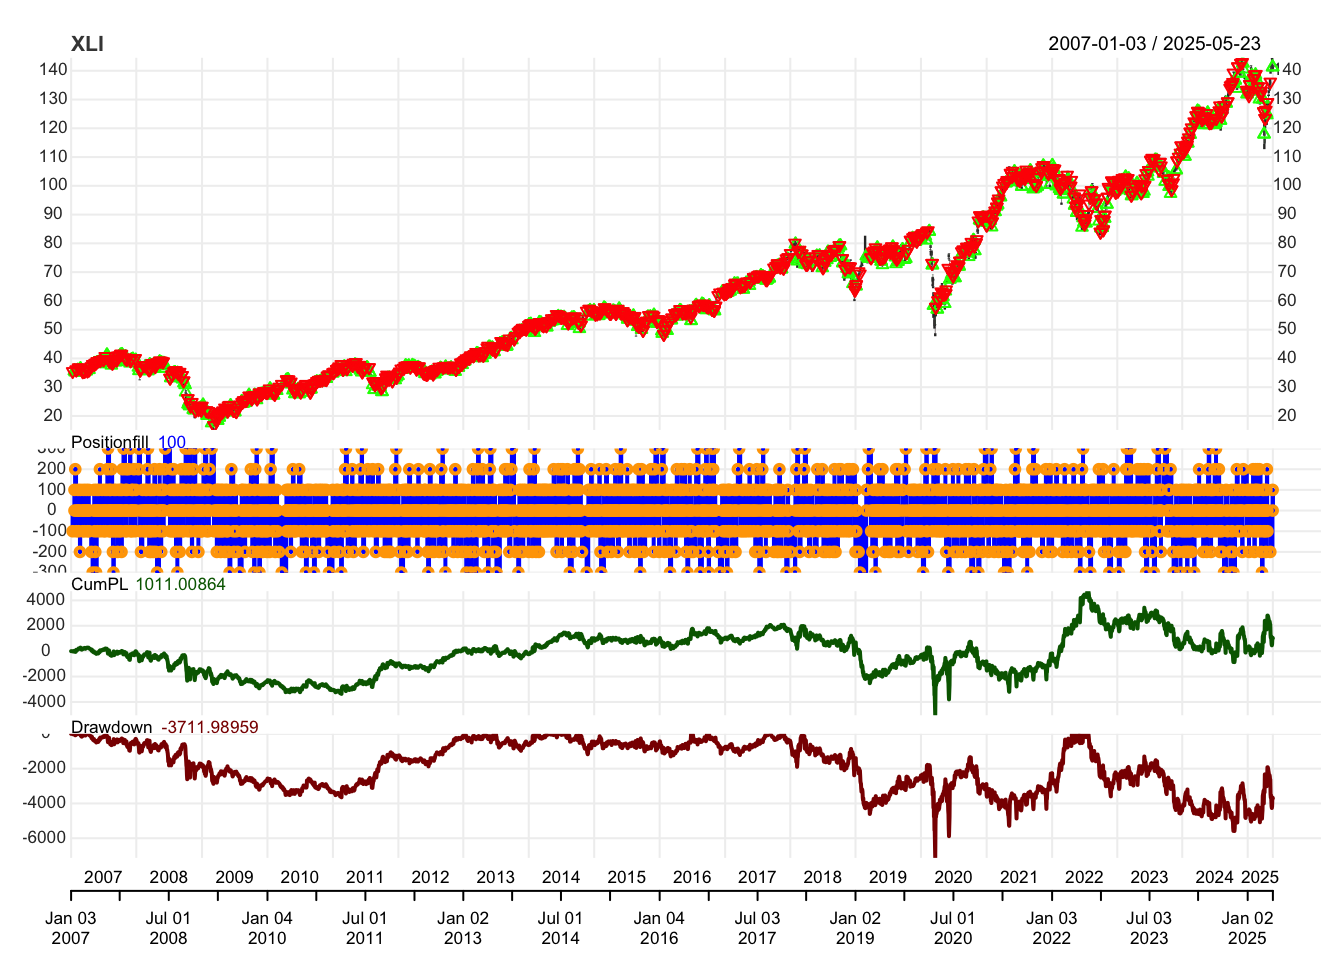
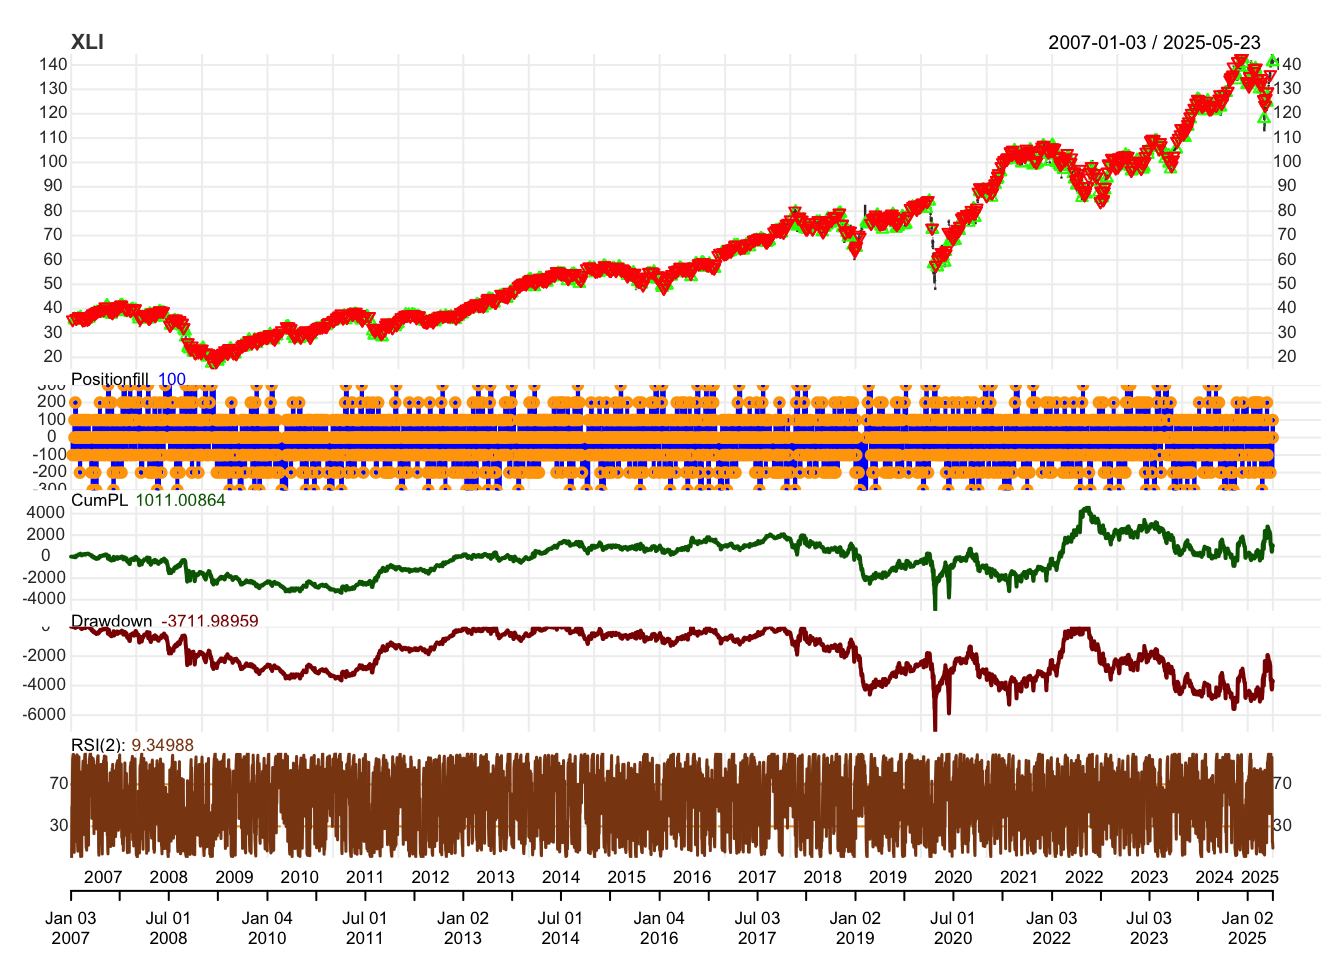
## [1] "XLI仓位图"
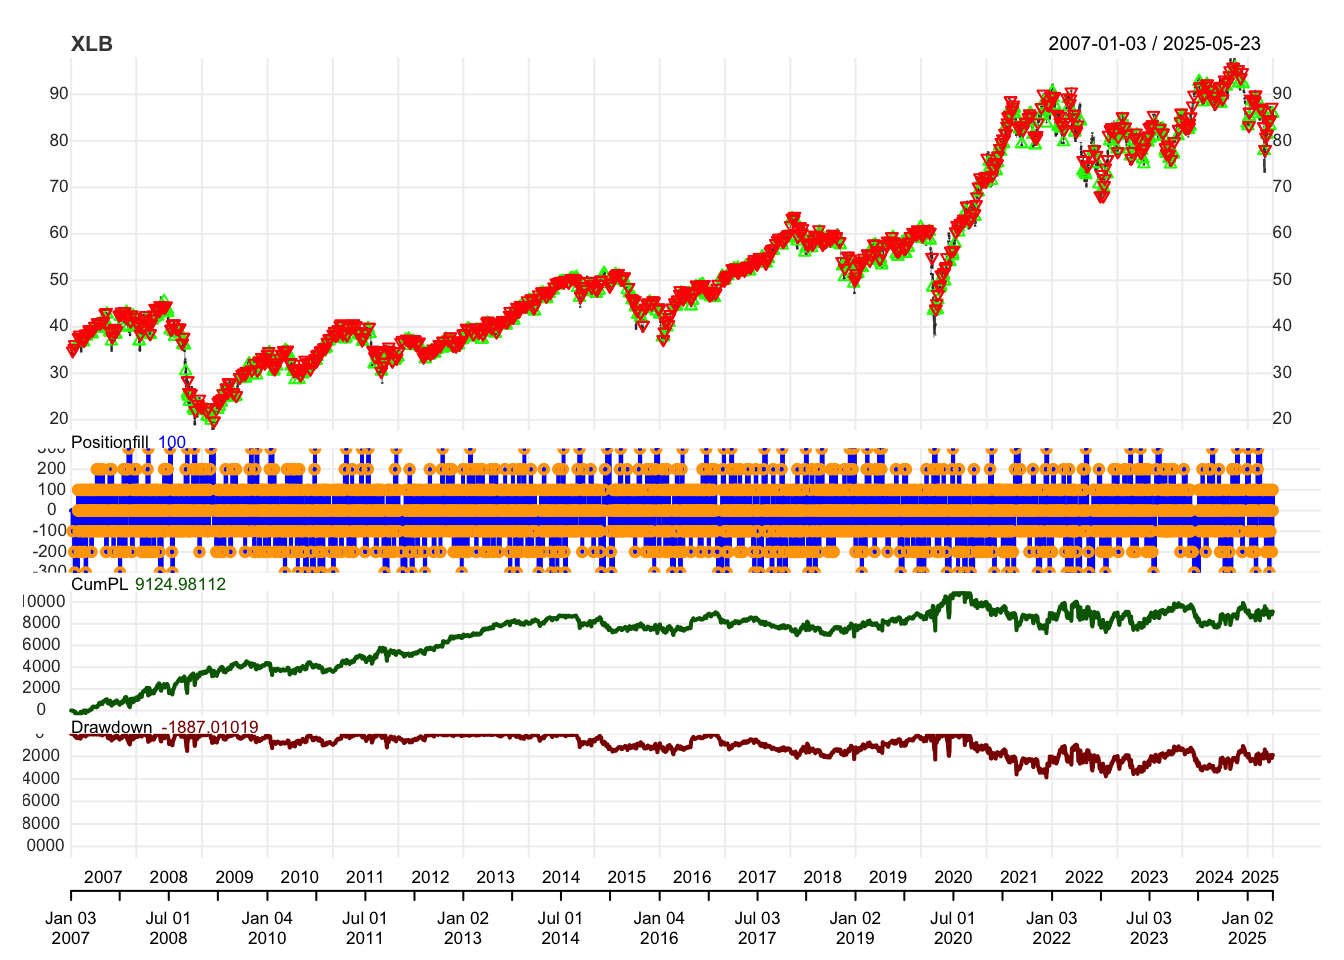
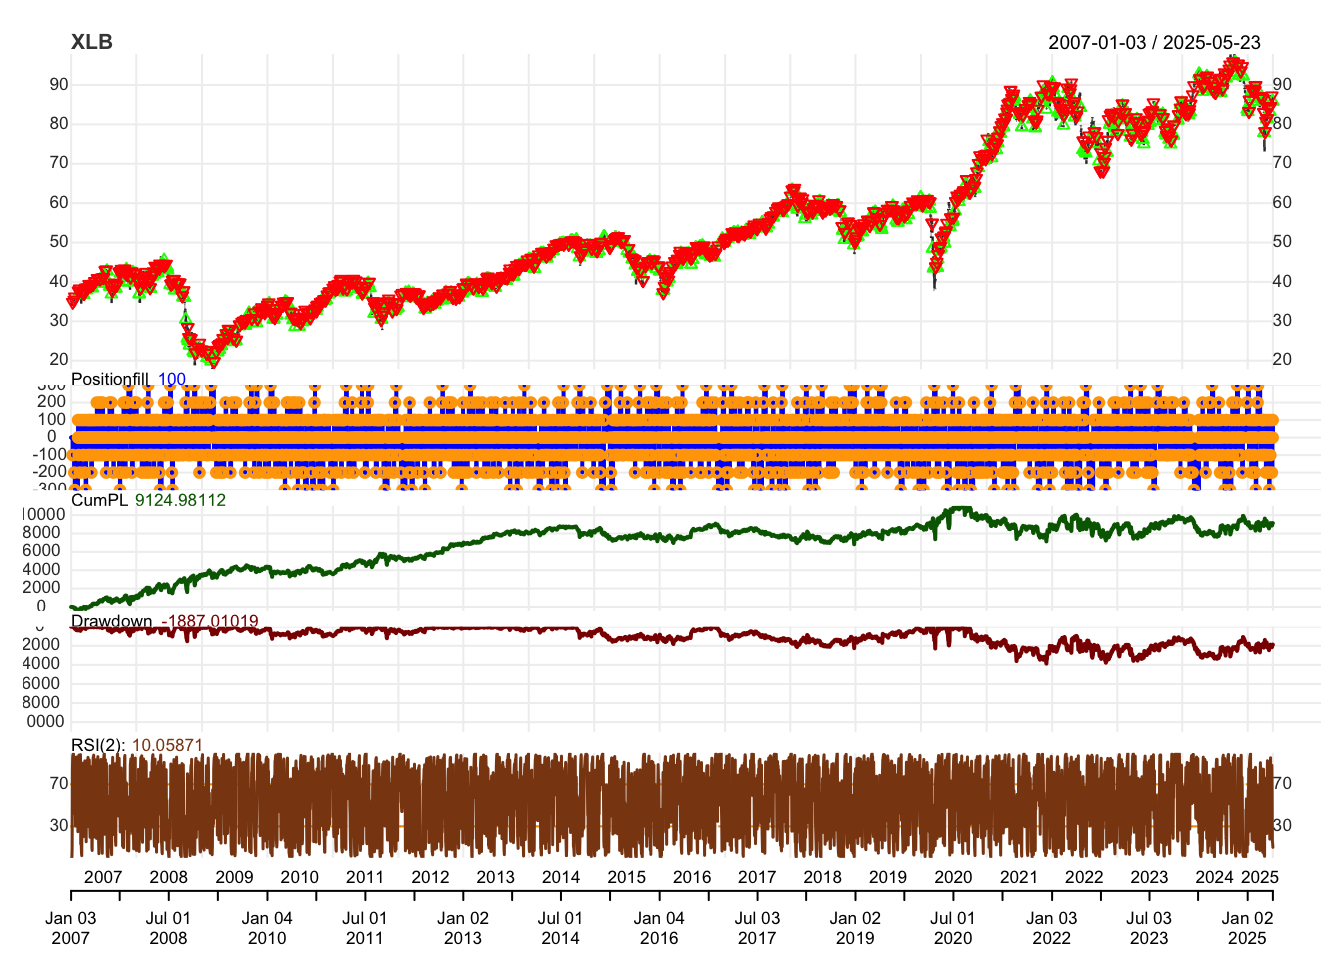
## [1] "XLB仓位图"
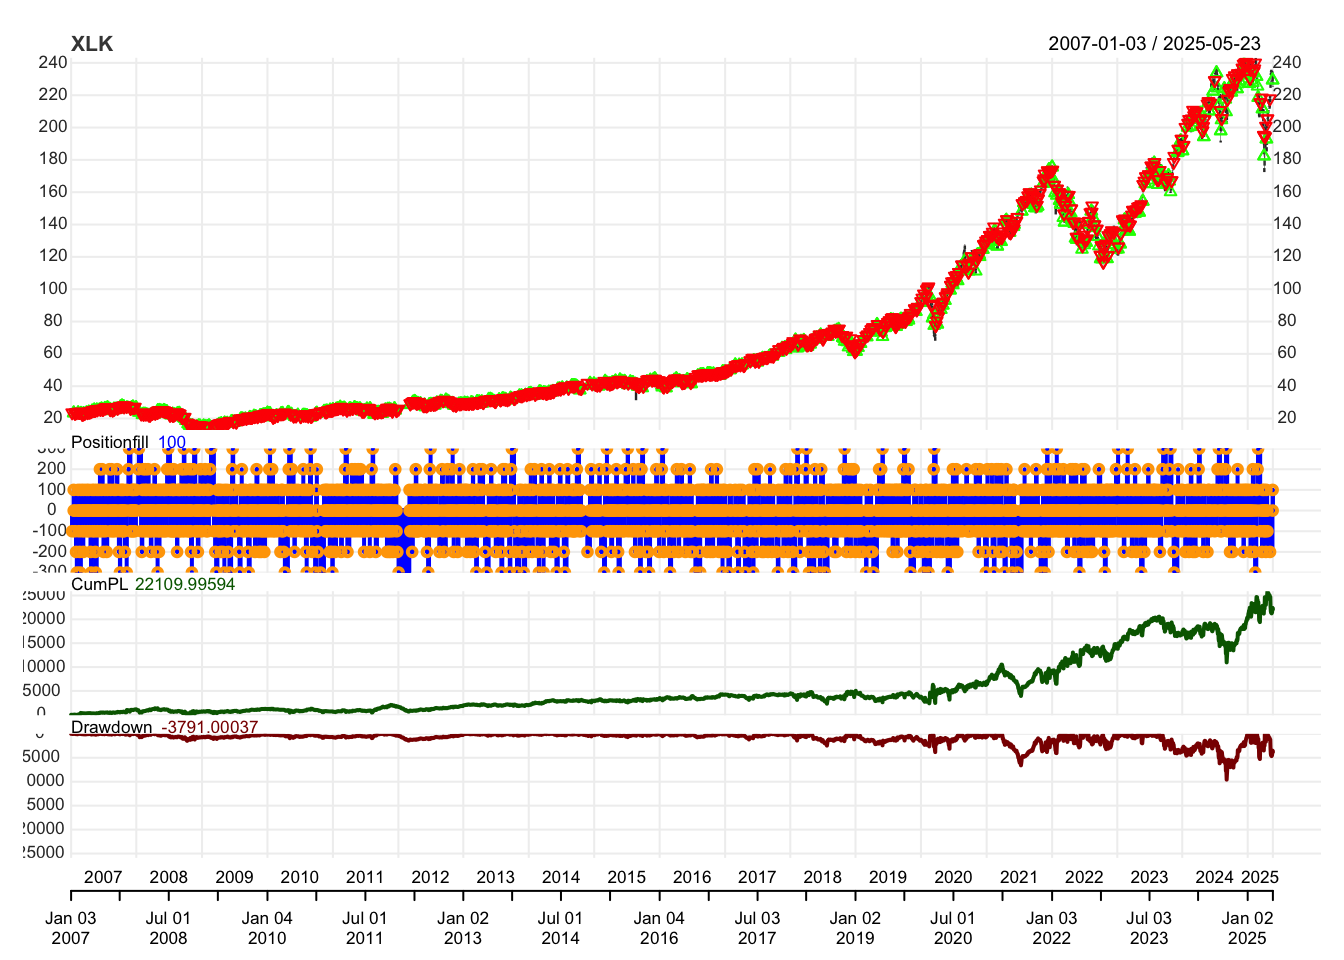
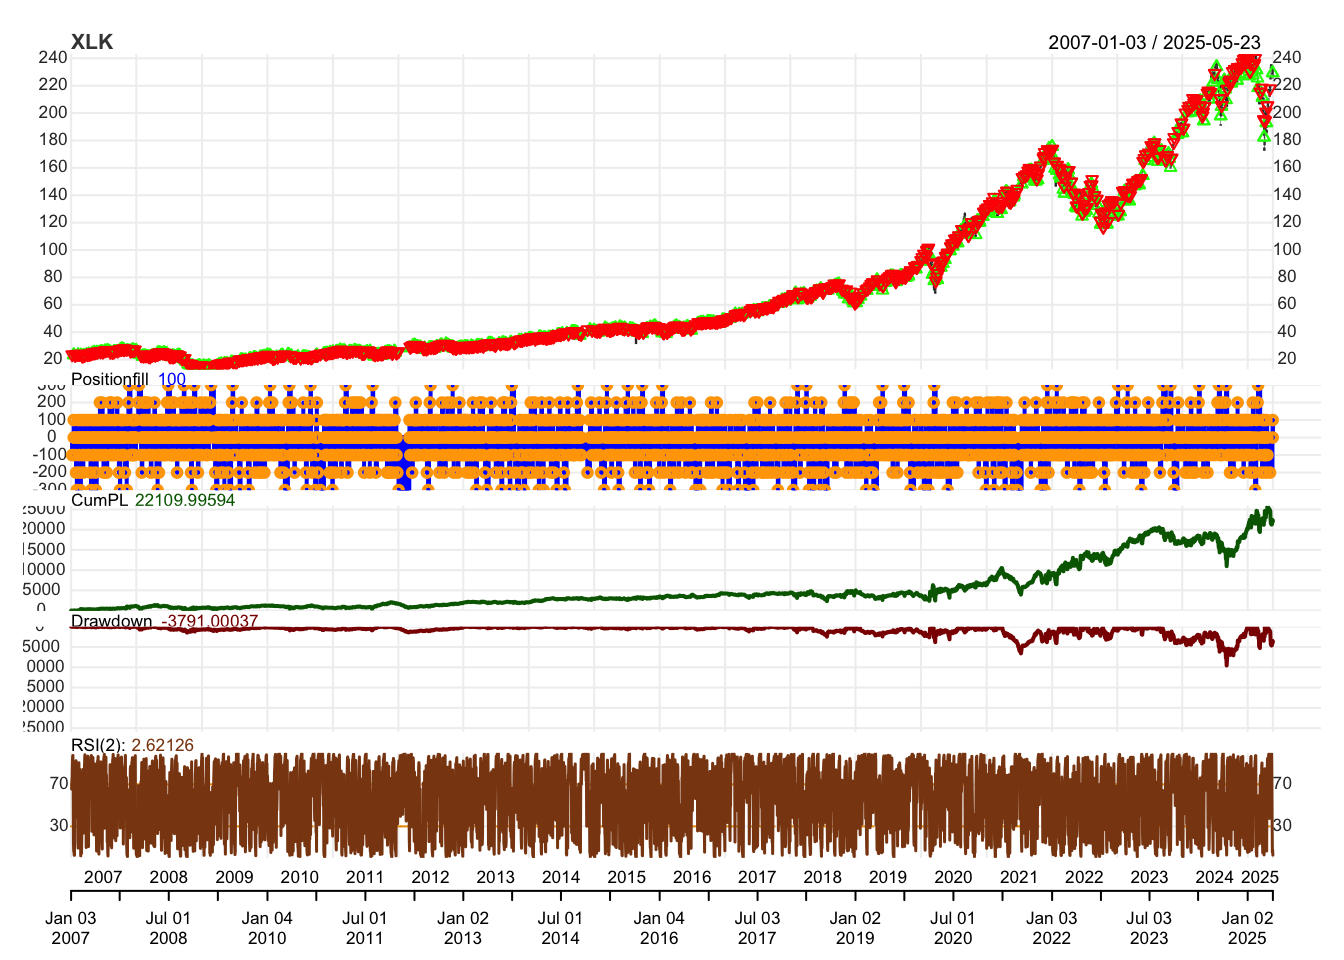
## [1] "XLK仓位图"
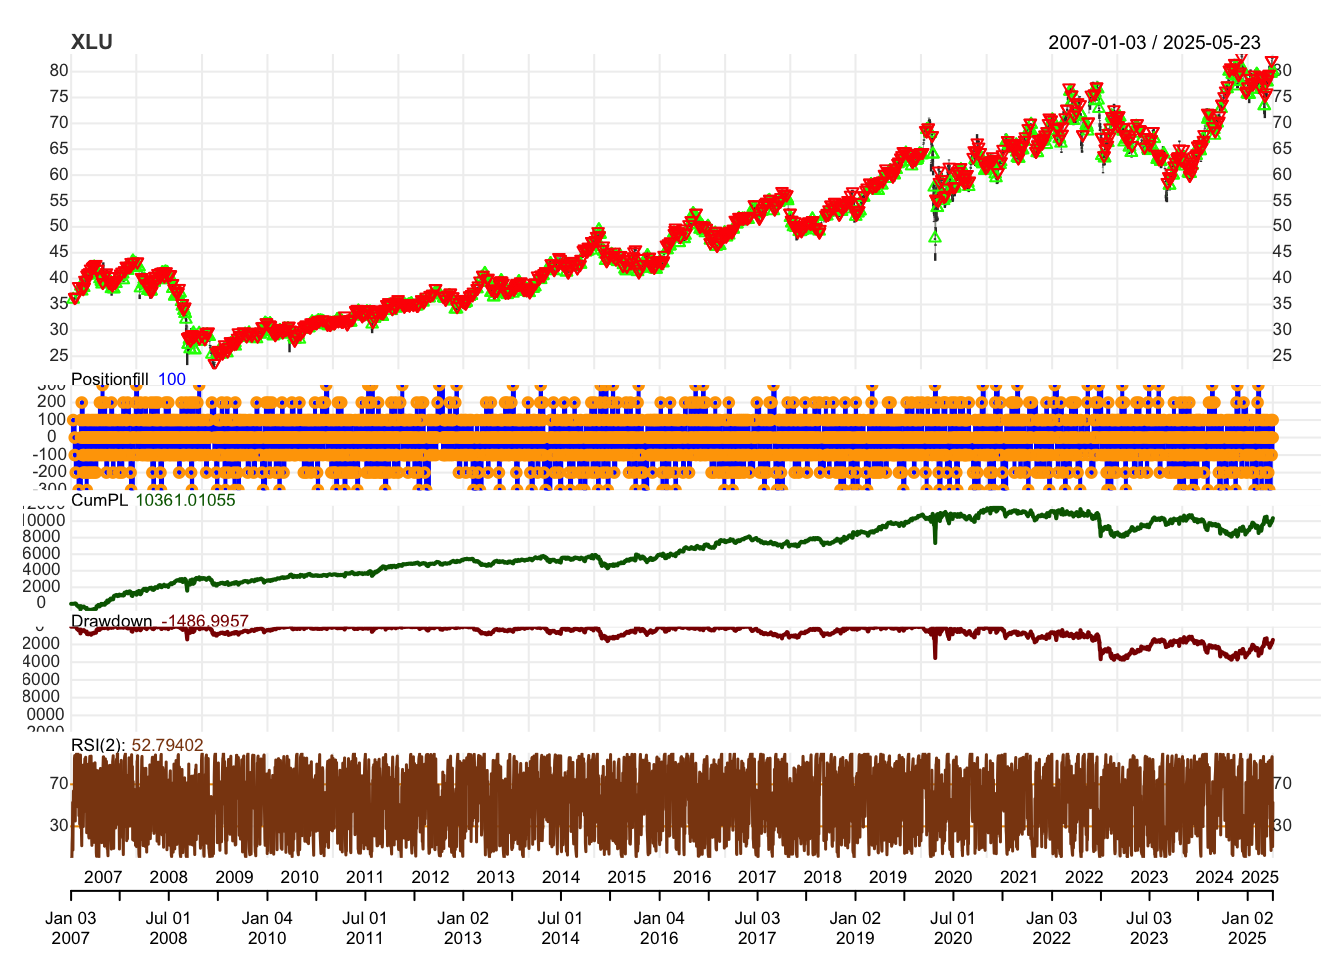
## [1] "XLU仓位图"
# 统计组合表现
ret1 <- PortfReturns(port.st)
ret1$total <- rowSums(ret1)


if("package:PerformanceAnalytics" %in% search() || require("PerformanceAnalytics",quietly=TRUE)) {
    dev.new()
    # 绘制收益率图
    charts.PerformanceSummary(ret1$total,geometric=FALSE,wealth.index=TRUE)
    print("策略总体表现")
}
## [1] "策略总体表现"
##### 查看交易统计信息 #########################################
# 查看交易单据
book  = getOrderBook(port.st)
# 查看交易统计
stats = tradeStats(port.st)
# 查看组合收益率
rets  = PortfReturns(port.st)
################################################################