本轮A股行情从2024年9月份启动到现在,上证指数已累计上涨了9.4%,深成指累计上涨12.9%,创业板指数累计上涨了33.7%。可谓汹涌上涨、波澜壮阔。
抓住了这波行情的投资者不用说自然是喜不胜收,那些错失前期行情的投资者,也开始抵挡不住赚钱的诱惑准备上车了。不过,千万不要太过性急!
# 安装必要包(若未安装)
# install.packages(c("quantmod", "ggplot2", "TTR", "scales", "gridExtra", "cowplot", "showtext"))

library(quantmod)
## Loading required package: xts## Loading required package: zoo##
## Attaching package: 'zoo'## The following objects are masked from 'package:base':
##
## as.Date, as.Date.numeric## Loading required package: TTR## Registered S3 method overwritten by 'quantmod':
## method from
## as.zoo.data.frame zoolibrary(ggplot2)
library(TTR)
library(scales)
library(gridExtra)
library(cowplot)
library(showtext)## Loading required package: sysfonts## Loading required package: showtextdb# 设置中文字体
font_add("SimHei", "SimHei.ttf") # 请确保系统中有SimHei字体,或指定正确路径
showtext_auto()
# 设置指数代码和名称
indices <- list(
"上证指数" = "000001.SS",
"沪深300" = "000300.SS",
"深证成指" = "399001.SZ"
)
# 获取数据(最近365天)
get_stock_data <- function(symbol) {
data <- tryCatch({
getSymbols(symbol, src = "yahoo", from = Sys.Date() - 365, auto.assign = FALSE)
}, error = function(e) {
message(paste("获取数据失败:", symbol, "-", e$message))
return(NULL)
})
return(data)
}
# 计算技术指标并准备数据
prepare_data <- function(data, index_name) {
if (is.null(data) || nrow(data) < 30) {
message(paste("数据不足或为空:", index_name))
return(NULL)
}
df <- data.frame(Date = index(data), coredata(data))
colnames(df) <- c("Date", "Open", "High", "Low", "Close", "Volume", "Adjusted")
# 计算收益率
df$Return <- c(NA, diff(log(df$Close)))
# 计算移动平均线
df$SMA5 <- SMA(df$Close, n = 5)
df$SMA20 <- SMA(df$Close, n = 20)
df$SMA60 <- SMA(df$Close, n = 60)
# 确保有足够的数据计算指标
if (nrow(df) > 26) {
# 计算MACD
macd_data <- tryCatch({
MACD(df$Close, nFast = 12, nSlow = 26, nSig = 9)
}, error = function(e) {
message(paste("计算MACD失败:", index_name, "-", e$message))
return(NULL)
})
if (!is.null(macd_data)) {
df$MACD <- macd_data[, "macd"]
df$Signal <- macd_data[, "signal"]
df$Histogram <- df$MACD - df$Signal
}
}
if (nrow(df) > 14) {
# 计算KDJ指标
kdj <- tryCatch({
stoch(df[, c("High", "Low", "Close")], nFastK = 14, nFastD = 3, nSlowD = 3)
}, error = function(e) {
message(paste("计算KDJ失败:", index_name, "-", e$message))
return(NULL)
})
if (!is.null(kdj)) {
df$K <- kdj[, "fastK"] * 100 # 转换为百分比
df$D <- kdj[, "fastD"] * 100 # 转换为百分比
df$J <- 3 * df$K - 2 * df$D # J线计算
}
# 计算RSI
df$RSI <- tryCatch({
RSI(df$Close, n = 14)
}, error = function(e) {
message(paste("计算RSI失败:", index_name, "-", e$message))
return(rep(NA, nrow(df)))
})
}
df$Index <- index_name
return(df)
}
# 获取所有指数数据
all_data <- list()
for (index_name in names(indices)) {
symbol <- indices[[index_name]]
data <- get_stock_data(symbol)
if (!is.null(data)) {
prepared_data <- prepare_data(data, index_name)
if (!is.null(prepared_data)) {
all_data[[index_name]] <- prepared_data
}
}
}
# 如果没有获取到任何数据,则停止执行
if (length(all_data) == 0) {
stop("未能获取到任何指数数据,请检查网络连接和代码设置")
}
# 合并所有数据
combined_data <- do.call(rbind, all_data)
# 1. 单独绘制价格走势图
price_plot <- ggplot(combined_data, aes(x = Date, y = Close, color = Index)) +
geom_line(size = 0.8) +
theme_bw() +
theme(
axis.title.x = element_blank(),
axis.title.y = element_blank(),
legend.position = "bottom",
text = element_text(family = "SimHei")
) +
scale_color_brewer(palette = "Set1") +
scale_y_continuous(labels = comma) +
# 为深证成指添加右侧Y轴
scale_y_continuous(
sec.axis = sec_axis(
~./max(combined_data$Close[combined_data$Index == "深证成指"], na.rm = TRUE) *
max(combined_data$Close[combined_data$Index != "深证成指"], na.rm = TRUE),
name = "深证成指"
)
)## Warning: Using `size` aesthetic for lines was deprecated in ggplot2 3.4.0.
## ℹ Please use `linewidth` instead.
## This warning is displayed once every 8 hours.
## Call `lifecycle::last_lifecycle_warnings()` to see where this warning was
## generated.## Scale for y is already present.
## Adding another scale for y, which will replace the existing scale.print(price_plot)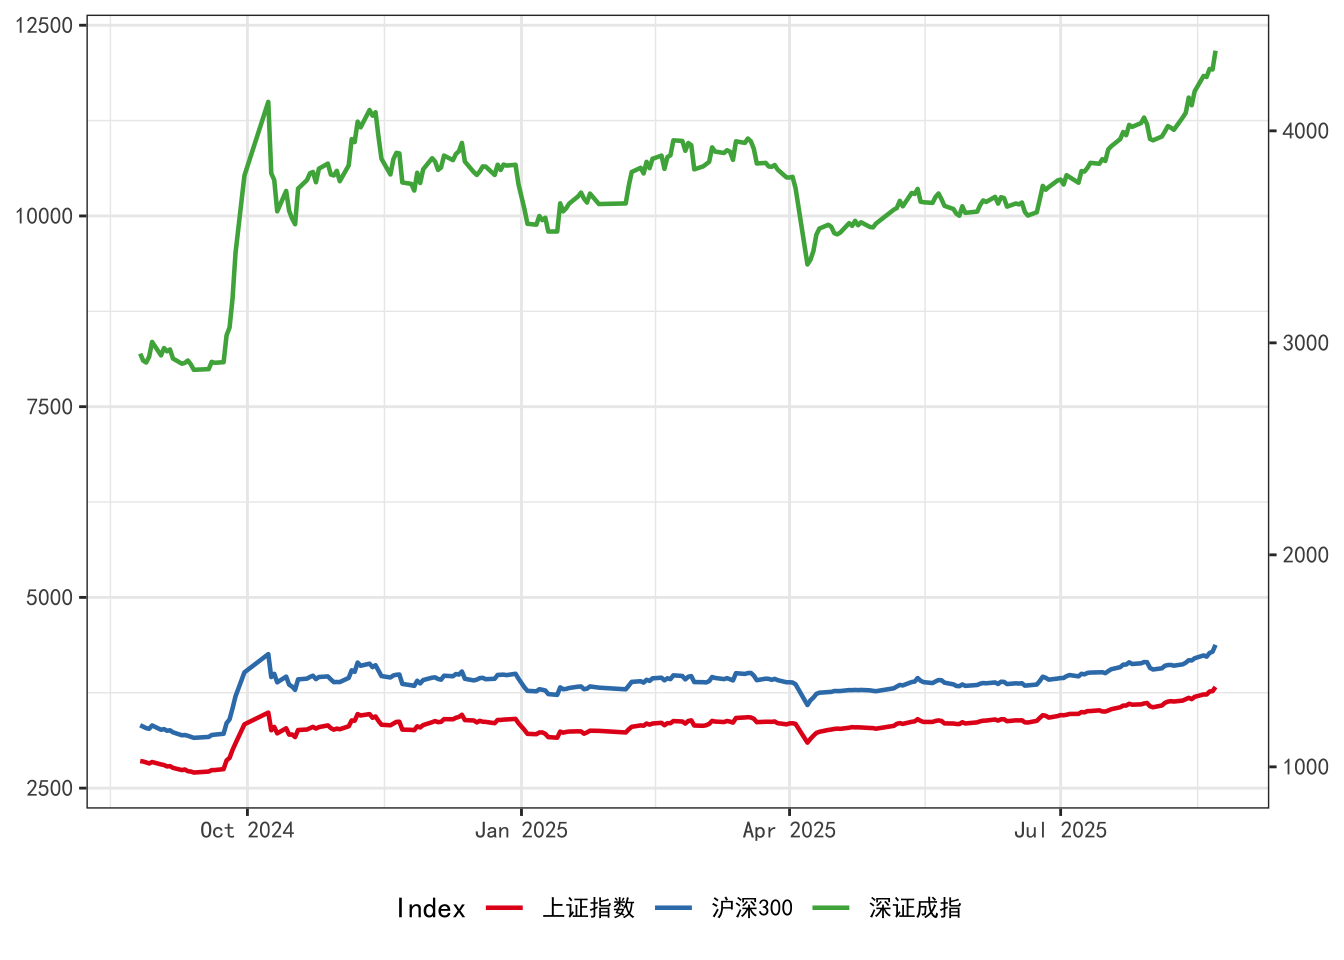
# 2. 单独绘制收益率走势图
return_range <- range(combined_data$Return, na.rm = TRUE)

return_plot <- ggplot(combined_data, aes(x = Date, y = Return, color = Index)) +
  geom_line(size = 0.8) +
  theme_bw() +
  theme(
    axis.title.x = element_blank(),
    axis.title.y = element_blank(),
    legend.position = "bottom",
    text = element_text(family = "SimHei")
  ) +
  scale_color_brewer(palette = "Set1") +
  scale_y_continuous(labels = percent, limits = return_range)

print(return_plot)
## Warning: Removed 3 rows containing missing values or values outside the scale range
## (`geom_line()`).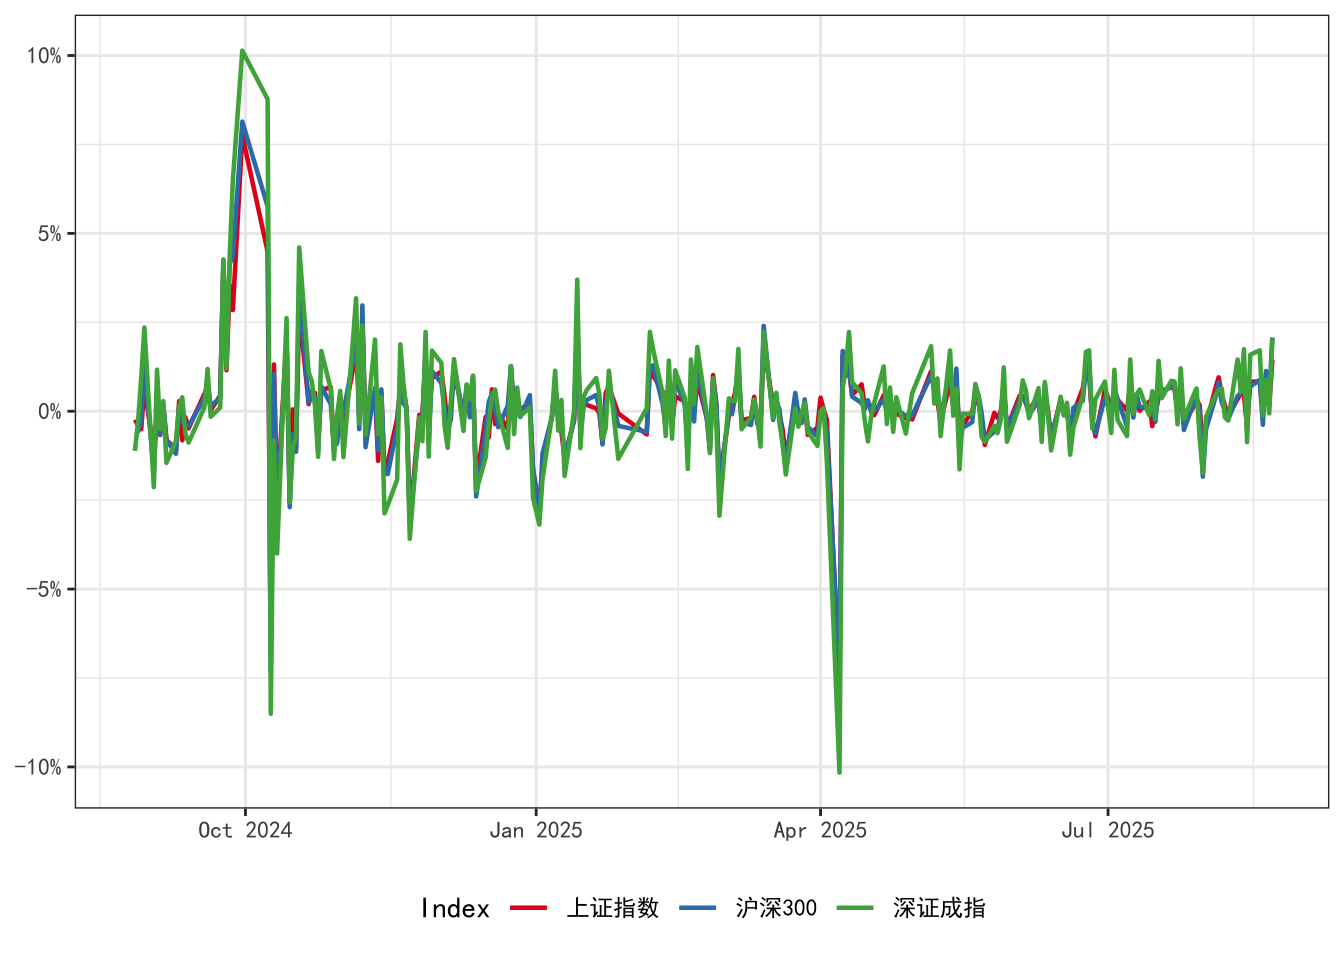
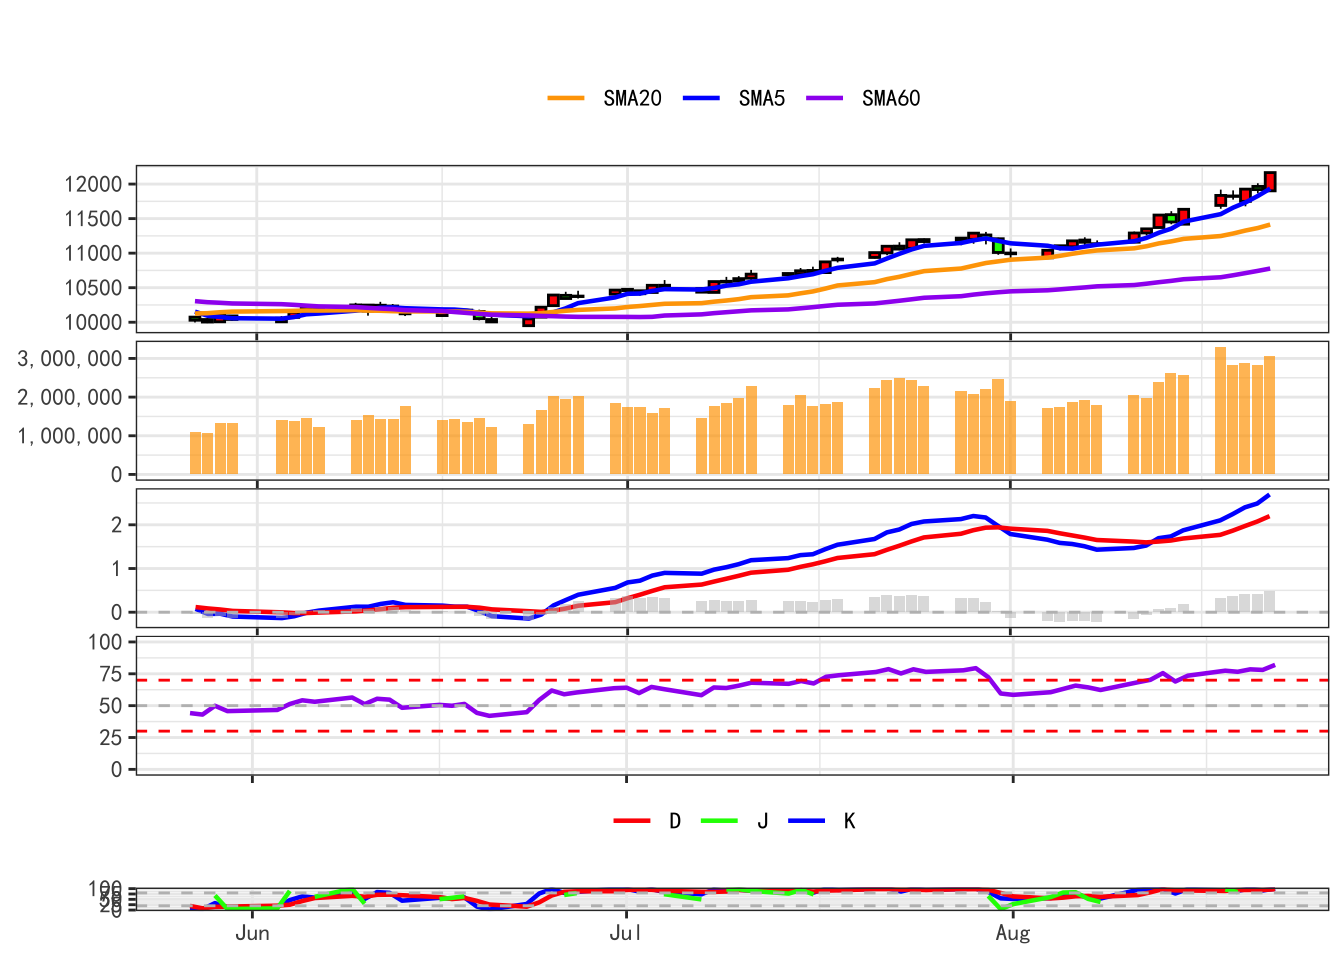
# 为每个指数单独绘制技术分析图
for (index_name in names(all_data)) {
  index_data <- all_data[[index_name]]

  # 筛选最近三个月的数据
  three_months_ago <- Sys.Date() - 90
  recent_data <- index_data[index_data$Date >= three_months_ago, ]

  # 创建蜡烛图
  candle_plot <- ggplot(recent_data, aes(x = Date)) +
    geom_linerange(aes(ymin = Low, ymax = High), color = "black", size = 0.3) +
    geom_rect(aes(xmin = Date - 0.4, xmax = Date + 0.4,
                  ymin = pmin(Open, Close), ymax = pmax(Open, Close),
                  fill = Close > Open), color = "black") +
    geom_line(aes(y = SMA5, color = "SMA5"), size = 0.8) +
    geom_line(aes(y = SMA20, color = "SMA20"), size = 0.8) +
    geom_line(aes(y = SMA60, color = "SMA60"), size = 0.8) +
    scale_fill_manual(values = c("TRUE" = "red", "FALSE" = "green"), guide = FALSE) +
    scale_color_manual(values = c("SMA5" = "blue", "SMA20" = "orange", "SMA60" = "purple")) +
    theme_bw() +
    theme(
      axis.title.x = element_blank(),
      axis.title.y = element_blank(),
      axis.text.x = element_blank(),
      legend.position = "top",
      legend.title = element_blank(),
      plot.margin = unit(c(5.5, 5.5, 0, 5.5), "points"),
      text = element_text(family = "SimHei")
    )

  # 成交量图
  volume_plot <- ggplot(recent_data, aes(x = Date, y = Volume)) +
    geom_col(fill = "orange", alpha = 0.7) +
    theme_bw() +
    theme(
      axis.title.x = element_blank(),
      axis.title.y = element_blank(),
      axis.text.x = element_blank(),
      plot.margin = unit(c(0, 5.5, 0, 5.5), "points"),
      text = element_text(family = "SimHei")
    ) +
    scale_y_continuous(labels = comma)

  # MACD图
  macd_plot <- ggplot(recent_data, aes(x = Date)) +
    geom_line(aes(y = MACD, color = "MACD"), size = 0.8) +
    geom_line(aes(y = Signal, color = "Signal"), size = 0.8) +
    geom_col(aes(y = Histogram, fill = "Histogram"), alpha = 0.5) +
    geom_hline(yintercept = 0, linetype = "dashed", color = "gray") +
    scale_color_manual(values = c("MACD" = "blue", "Signal" = "red")) +
    scale_fill_manual(values = c("Histogram" = "gray")) +
    theme_bw() +
    theme(
      axis.title.x = element_blank(),
      axis.title.y = element_blank(),
      axis.text.x = element_blank(),
      legend.position = "none",
      plot.margin = unit(c(0, 5.5, 0, 5.5), "points"),
      text = element_text(family = "SimHei")
    )

  # RSI图
  rsi_plot <- ggplot(recent_data, aes(x = Date, y = RSI)) +
    geom_line(color = "purple", size = 0.8) +
    geom_hline(yintercept = c(30, 70), linetype = "dashed", color = "red") +
    geom_hline(yintercept = 50, linetype = "dashed", color = "gray") +
    theme_bw() +
    theme(
      axis.title.x = element_blank(),
      axis.title.y = element_blank(),
      axis.text.x = element_blank(),
      plot.margin = unit(c(0, 5.5, 0, 5.5), "points"),
      text = element_text(family = "SimHei")
    ) +
    ylim(0, 100)

  # KDJ图(保留日期标签)
  kdj_plot <- ggplot(recent_data, aes(x = Date)) +
    geom_line(aes(y = K, color = "K"), size = 0.8) +
    geom_line(aes(y = D, color = "D"), size = 0.8) +
    geom_line(aes(y = J, color = "J"), size = 0.8) +
    geom_hline(yintercept = c(20, 80), linetype = "dashed", color = "gray") +
    scale_color_manual(values = c("K" = "blue", "D" = "red", "J" = "green")) +
    theme_bw() +
    theme(
      axis.title.x = element_blank(),
      axis.title.y = element_blank(),
      legend.position = "top",
      legend.title = element_blank(),
      plot.margin = unit(c(0, 5.5, 5.5, 5.5), "points"),
      text = element_text(family = "SimHei")
    ) +
    ylim(0, 100)

  # 组合图表
  index_plot <- plot_grid(
    candle_plot,
    volume_plot,
    macd_plot,
    rsi_plot,
    kdj_plot,
    ncol = 1,
    align = "v",
    rel_heights = c(2, 1, 1, 1, 1.2)
  )

  final_plot <- plot_grid(
    title, index_plot,
    ncol = 1,
    rel_heights = c(0.05, 1)
  )

  # 显示图表
  print(final_plot)
}
## Warning: The `guide` argument in `scale_*()` cannot be `FALSE`. This was deprecated in
## ggplot2 3.3.4.
## ℹ Please use "none" instead.
## This warning is displayed once every 8 hours.
## Call `lifecycle::last_lifecycle_warnings()` to see where this warning was
## generated.## Warning in grid.Call(C_stringMetric, as.graphicsAnnot(x$label)): font family
## 'SimHei' not found in PostScript font database
## Warning in grid.Call(C_stringMetric, as.graphicsAnnot(x$label)): font family
## 'SimHei' not found in PostScript font database
## Warning in grid.Call(C_stringMetric, as.graphicsAnnot(x$label)): font family
## 'SimHei' not found in PostScript font database
## Warning in grid.Call(C_stringMetric, as.graphicsAnnot(x$label)): font family
## 'SimHei' not found in PostScript font database
## Warning in grid.Call(C_stringMetric, as.graphicsAnnot(x$label)): font family
## 'SimHei' not found in PostScript font database
## Warning in grid.Call(C_stringMetric, as.graphicsAnnot(x$label)): font family
## 'SimHei' not found in PostScript font database
## Warning in grid.Call(C_stringMetric, as.graphicsAnnot(x$label)): font family
## 'SimHei' not found in PostScript font database
## Warning in grid.Call(C_stringMetric, as.graphicsAnnot(x$label)): font family
## 'SimHei' not found in PostScript font database
## Warning in grid.Call(C_stringMetric, as.graphicsAnnot(x$label)): font family
## 'SimHei' not found in PostScript font database
## Warning in grid.Call(C_stringMetric, as.graphicsAnnot(x$label)): font family
## 'SimHei' not found in PostScript font database
## Warning in grid.Call(C_stringMetric, as.graphicsAnnot(x$label)): font family
## 'SimHei' not found in PostScript font database
## Warning in grid.Call(C_stringMetric, as.graphicsAnnot(x$label)): font family
## 'SimHei' not found in PostScript font database
## Warning in grid.Call(C_stringMetric, as.graphicsAnnot(x$label)): font family
## 'SimHei' not found in PostScript font database
## Warning in grid.Call(C_stringMetric, as.graphicsAnnot(x$label)): font family
## 'SimHei' not found in PostScript font database## Warning in grid.Call(C_textBounds, as.graphicsAnnot(x$label), x$x, x$y, : font
## family 'SimHei' not found in PostScript font database
## Warning in grid.Call(C_textBounds, as.graphicsAnnot(x$label), x$x, x$y, : font
## family 'SimHei' not found in PostScript font database
## Warning in grid.Call(C_textBounds, as.graphicsAnnot(x$label), x$x, x$y, : font
## family 'SimHei' not found in PostScript font database
## Warning in grid.Call(C_textBounds, as.graphicsAnnot(x$label), x$x, x$y, : font
## family 'SimHei' not found in PostScript font database
## Warning in grid.Call(C_textBounds, as.graphicsAnnot(x$label), x$x, x$y, : font
## family 'SimHei' not found in PostScript font database
## Warning in grid.Call(C_textBounds, as.graphicsAnnot(x$label), x$x, x$y, : font
## family 'SimHei' not found in PostScript font database
## Warning in grid.Call(C_textBounds, as.graphicsAnnot(x$label), x$x, x$y, : font
## family 'SimHei' not found in PostScript font database
## Warning in grid.Call(C_textBounds, as.graphicsAnnot(x$label), x$x, x$y, : font
## family 'SimHei' not found in PostScript font database
## Warning in grid.Call(C_textBounds, as.graphicsAnnot(x$label), x$x, x$y, : font
## family 'SimHei' not found in PostScript font database
## Warning in grid.Call(C_textBounds, as.graphicsAnnot(x$label), x$x, x$y, : font
## family 'SimHei' not found in PostScript font database
## Warning in grid.Call(C_textBounds, as.graphicsAnnot(x$label), x$x, x$y, : font
## family 'SimHei' not found in PostScript font database
## Warning in grid.Call(C_textBounds, as.graphicsAnnot(x$label), x$x, x$y, : font
## family 'SimHei' not found in PostScript font database
## Warning in grid.Call(C_textBounds, as.graphicsAnnot(x$label), x$x, x$y, : font
## family 'SimHei' not found in PostScript font database
## Warning in grid.Call(C_textBounds, as.graphicsAnnot(x$label), x$x, x$y, : font
## family 'SimHei' not found in PostScript font database
## Warning in grid.Call(C_textBounds, as.graphicsAnnot(x$label), x$x, x$y, : font
## family 'SimHei' not found in PostScript font database
## Warning in grid.Call(C_textBounds, as.graphicsAnnot(x$label), x$x, x$y, : font
## family 'SimHei' not found in PostScript font database
## Warning in grid.Call(C_textBounds, as.graphicsAnnot(x$label), x$x, x$y, : font
## family 'SimHei' not found in PostScript font database
## Warning in grid.Call(C_textBounds, as.graphicsAnnot(x$label), x$x, x$y, : font
## family 'SimHei' not found in PostScript font database
## Warning in grid.Call(C_textBounds, as.graphicsAnnot(x$label), x$x, x$y, : font
## family 'SimHei' not found in PostScript font database
## Warning in grid.Call(C_textBounds, as.graphicsAnnot(x$label), x$x, x$y, : font
## family 'SimHei' not found in PostScript font database
## Warning in grid.Call(C_textBounds, as.graphicsAnnot(x$label), x$x, x$y, : font
## family 'SimHei' not found in PostScript font database
## Warning in grid.Call(C_textBounds, as.graphicsAnnot(x$label), x$x, x$y, : font
## family 'SimHei' not found in PostScript font database
## Warning in grid.Call(C_textBounds, as.graphicsAnnot(x$label), x$x, x$y, : font
## family 'SimHei' not found in PostScript font database
## Warning in grid.Call(C_textBounds, as.graphicsAnnot(x$label), x$x, x$y, : font
## family 'SimHei' not found in PostScript font database
## Warning in grid.Call(C_textBounds, as.graphicsAnnot(x$label), x$x, x$y, : font
## family 'SimHei' not found in PostScript font database
## Warning in grid.Call(C_textBounds, as.graphicsAnnot(x$label), x$x, x$y, : font
## family 'SimHei' not found in PostScript font database
## Warning in grid.Call(C_textBounds, as.graphicsAnnot(x$label), x$x, x$y, : font
## family 'SimHei' not found in PostScript font database
## Warning in grid.Call(C_textBounds, as.graphicsAnnot(x$label), x$x, x$y, : font
## family 'SimHei' not found in PostScript font database## Warning: Removed 3 rows containing missing values or values outside the scale range
## (`geom_line()`).## Warning in grid.Call(C_textBounds, as.graphicsAnnot(x$label), x$x, x$y, : font
## family 'SimHei' not found in PostScript font database
## Warning in grid.Call(C_textBounds, as.graphicsAnnot(x$label), x$x, x$y, : font
## family 'SimHei' not found in PostScript font database
## Warning in grid.Call(C_textBounds, as.graphicsAnnot(x$label), x$x, x$y, : font
## family 'SimHei' not found in PostScript font database
## Warning in grid.Call(C_textBounds, as.graphicsAnnot(x$label), x$x, x$y, : font
## family 'SimHei' not found in PostScript font database
## Warning in grid.Call(C_textBounds, as.graphicsAnnot(x$label), x$x, x$y, : font
## family 'SimHei' not found in PostScript font database
## Warning in grid.Call(C_textBounds, as.graphicsAnnot(x$label), x$x, x$y, : font
## family 'SimHei' not found in PostScript font database
## Warning in grid.Call(C_textBounds, as.graphicsAnnot(x$label), x$x, x$y, : font
## family 'SimHei' not found in PostScript font database
## Warning in grid.Call(C_textBounds, as.graphicsAnnot(x$label), x$x, x$y, : font
## family 'SimHei' not found in PostScript font database
## Warning in grid.Call(C_textBounds, as.graphicsAnnot(x$label), x$x, x$y, : font
## family 'SimHei' not found in PostScript font database
## Warning in grid.Call(C_textBounds, as.graphicsAnnot(x$label), x$x, x$y, : font
## family 'SimHei' not found in PostScript font database
## Warning in grid.Call(C_textBounds, as.graphicsAnnot(x$label), x$x, x$y, : font
## family 'SimHei' not found in PostScript font database
## Warning in grid.Call(C_textBounds, as.graphicsAnnot(x$label), x$x, x$y, : font
## family 'SimHei' not found in PostScript font database
## Warning in grid.Call(C_textBounds, as.graphicsAnnot(x$label), x$x, x$y, : font
## family 'SimHei' not found in PostScript font database
## Warning in grid.Call(C_textBounds, as.graphicsAnnot(x$label), x$x, x$y, : font
## family 'SimHei' not found in PostScript font database
## Warning in grid.Call(C_textBounds, as.graphicsAnnot(x$label), x$x, x$y, : font
## family 'SimHei' not found in PostScript font database## Warning: Package `gridGraphics` is required to handle base-R plots.
## Substituting empty plot.## Warning in grid.Call(C_textBounds, as.graphicsAnnot(x$label), x$x, x$y, : font
## family 'SimHei' not found in PostScript font database
## Warning in grid.Call(C_textBounds, as.graphicsAnnot(x$label), x$x, x$y, : font
## family 'SimHei' not found in PostScript font database
## Warning in grid.Call(C_textBounds, as.graphicsAnnot(x$label), x$x, x$y, : font
## family 'SimHei' not found in PostScript font database
## Warning in grid.Call(C_textBounds, as.graphicsAnnot(x$label), x$x, x$y, : font
## family 'SimHei' not found in PostScript font database
## Warning in grid.Call(C_textBounds, as.graphicsAnnot(x$label), x$x, x$y, : font
## family 'SimHei' not found in PostScript font database
## Warning in grid.Call(C_textBounds, as.graphicsAnnot(x$label), x$x, x$y, : font
## family 'SimHei' not found in PostScript font database
## Warning in grid.Call(C_textBounds, as.graphicsAnnot(x$label), x$x, x$y, : font
## family 'SimHei' not found in PostScript font database
## Warning in grid.Call(C_textBounds, as.graphicsAnnot(x$label), x$x, x$y, : font
## family 'SimHei' not found in PostScript font database
## Warning in grid.Call(C_textBounds, as.graphicsAnnot(x$label), x$x, x$y, : font
## family 'SimHei' not found in PostScript font database
## Warning in grid.Call(C_textBounds, as.graphicsAnnot(x$label), x$x, x$y, : font
## family 'SimHei' not found in PostScript font database
## Warning in grid.Call(C_textBounds, as.graphicsAnnot(x$label), x$x, x$y, : font
## family 'SimHei' not found in PostScript font database
## Warning in grid.Call(C_textBounds, as.graphicsAnnot(x$label), x$x, x$y, : font
## family 'SimHei' not found in PostScript font database
## Warning in grid.Call(C_textBounds, as.graphicsAnnot(x$label), x$x, x$y, : font
## family 'SimHei' not found in PostScript font database
## Warning in grid.Call(C_textBounds, as.graphicsAnnot(x$label), x$x, x$y, : font
## family 'SimHei' not found in PostScript font database
## Warning in grid.Call(C_textBounds, as.graphicsAnnot(x$label), x$x, x$y, : font
## family 'SimHei' not found in PostScript font database
## Warning in grid.Call(C_textBounds, as.graphicsAnnot(x$label), x$x, x$y, : font
## family 'SimHei' not found in PostScript font database
## Warning in grid.Call(C_textBounds, as.graphicsAnnot(x$label), x$x, x$y, : font
## family 'SimHei' not found in PostScript font database
## Warning in grid.Call(C_textBounds, as.graphicsAnnot(x$label), x$x, x$y, : font
## family 'SimHei' not found in PostScript font database
## Warning in grid.Call(C_textBounds, as.graphicsAnnot(x$label), x$x, x$y, : font
## family 'SimHei' not found in PostScript font database
## Warning in grid.Call(C_textBounds, as.graphicsAnnot(x$label), x$x, x$y, : font
## family 'SimHei' not found in PostScript font database
## Warning in grid.Call(C_textBounds, as.graphicsAnnot(x$label), x$x, x$y, : font
## family 'SimHei' not found in PostScript font database
## Warning in grid.Call(C_textBounds, as.graphicsAnnot(x$label), x$x, x$y, : font
## family 'SimHei' not found in PostScript font database
## Warning in grid.Call(C_textBounds, as.graphicsAnnot(x$label), x$x, x$y, : font
## family 'SimHei' not found in PostScript font database
## Warning in grid.Call(C_textBounds, as.graphicsAnnot(x$label), x$x, x$y, : font
## family 'SimHei' not found in PostScript font database
## Warning in grid.Call(C_textBounds, as.graphicsAnnot(x$label), x$x, x$y, : font
## family 'SimHei' not found in PostScript font database
## Warning in grid.Call(C_textBounds, as.graphicsAnnot(x$label), x$x, x$y, : font
## family 'SimHei' not found in PostScript font database
## Warning in grid.Call(C_textBounds, as.graphicsAnnot(x$label), x$x, x$y, : font
## family 'SimHei' not found in PostScript font database
## Warning in grid.Call(C_textBounds, as.graphicsAnnot(x$label), x$x, x$y, : font
## family 'SimHei' not found in PostScript font database
## Warning in grid.Call(C_textBounds, as.graphicsAnnot(x$label), x$x, x$y, : font
## family 'SimHei' not found in PostScript font database
## Warning in grid.Call(C_textBounds, as.graphicsAnnot(x$label), x$x, x$y, : font
## family 'SimHei' not found in PostScript font database## Warning: Removed 3 rows containing missing values or values outside the scale range
## (`geom_line()`).## Warning in grid.Call(C_textBounds, as.graphicsAnnot(x$label), x$x, x$y, : font
## family 'SimHei' not found in PostScript font database
## Warning in grid.Call(C_textBounds, as.graphicsAnnot(x$label), x$x, x$y, : font
## family 'SimHei' not found in PostScript font database
## Warning in grid.Call(C_textBounds, as.graphicsAnnot(x$label), x$x, x$y, : font
## family 'SimHei' not found in PostScript font database
## Warning in grid.Call(C_textBounds, as.graphicsAnnot(x$label), x$x, x$y, : font
## family 'SimHei' not found in PostScript font database
## Warning in grid.Call(C_textBounds, as.graphicsAnnot(x$label), x$x, x$y, : font
## family 'SimHei' not found in PostScript font database
## Warning in grid.Call(C_textBounds, as.graphicsAnnot(x$label), x$x, x$y, : font
## family 'SimHei' not found in PostScript font database
## Warning in grid.Call(C_textBounds, as.graphicsAnnot(x$label), x$x, x$y, : font
## family 'SimHei' not found in PostScript font database
## Warning in grid.Call(C_textBounds, as.graphicsAnnot(x$label), x$x, x$y, : font
## family 'SimHei' not found in PostScript font database
## Warning in grid.Call(C_textBounds, as.graphicsAnnot(x$label), x$x, x$y, : font
## family 'SimHei' not found in PostScript font database
## Warning in grid.Call(C_textBounds, as.graphicsAnnot(x$label), x$x, x$y, : font
## family 'SimHei' not found in PostScript font database
## Warning in grid.Call(C_textBounds, as.graphicsAnnot(x$label), x$x, x$y, : font
## family 'SimHei' not found in PostScript font database
## Warning in grid.Call(C_textBounds, as.graphicsAnnot(x$label), x$x, x$y, : font
## family 'SimHei' not found in PostScript font database
## Warning in grid.Call(C_textBounds, as.graphicsAnnot(x$label), x$x, x$y, : font
## family 'SimHei' not found in PostScript font database
## Warning in grid.Call(C_textBounds, as.graphicsAnnot(x$label), x$x, x$y, : font
## family 'SimHei' not found in PostScript font database
## Warning in grid.Call(C_textBounds, as.graphicsAnnot(x$label), x$x, x$y, : font
## family 'SimHei' not found in PostScript font database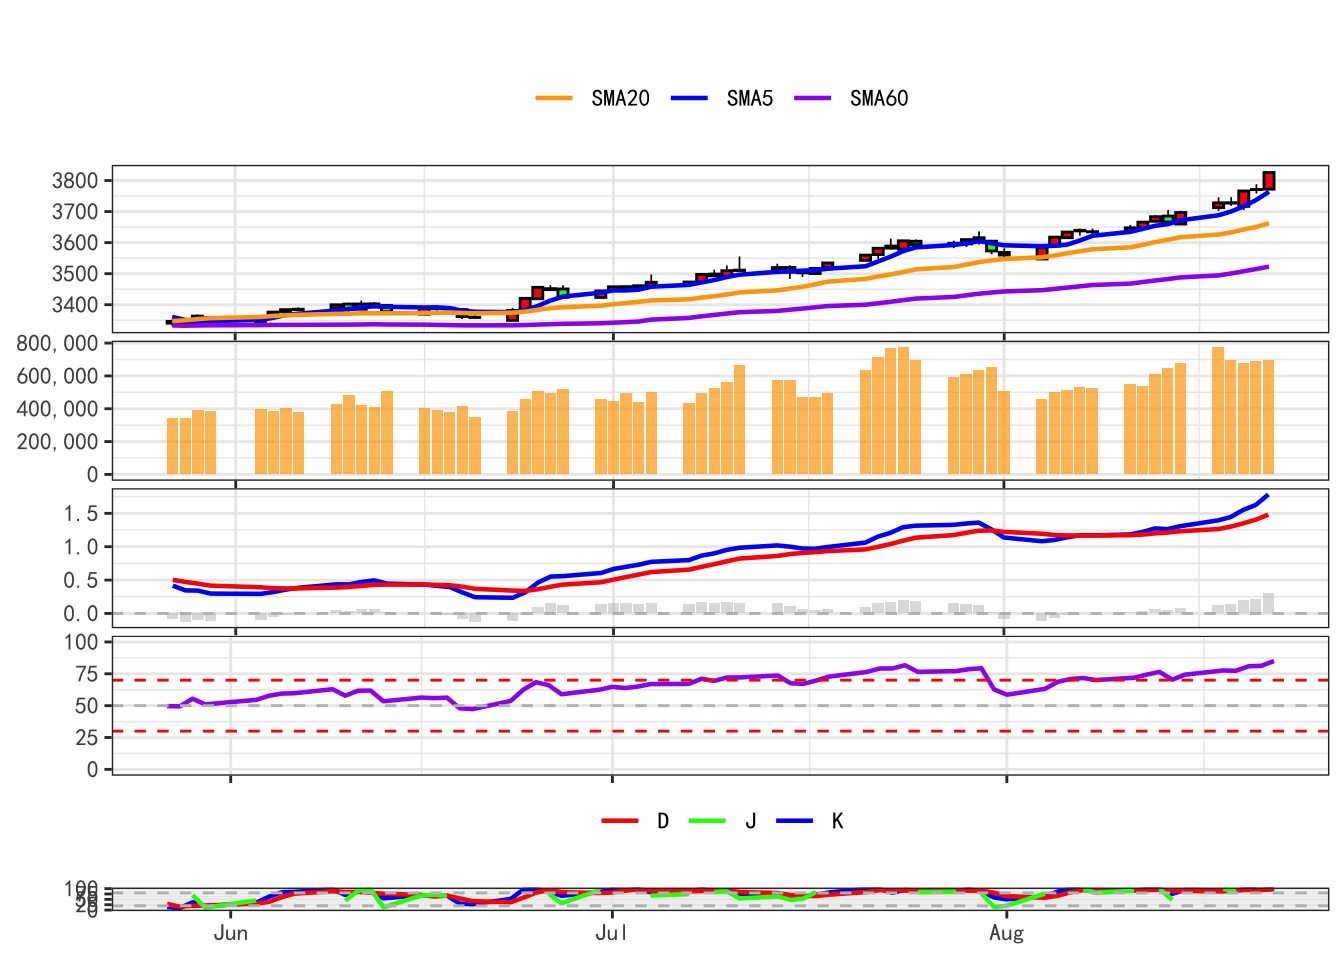
## Warning: Package `gridGraphics` is required to handle base-R plots.
## Substituting empty plot.
## Warning: font family 'SimHei' not found in PostScript font database
## Warning: font family 'SimHei' not found in PostScript font database
## Warning: font family 'SimHei' not found in PostScript font database
## Warning: font family 'SimHei' not found in PostScript font database
## Warning: font family 'SimHei' not found in PostScript font database
## Warning: font family 'SimHei' not found in PostScript font database
## Warning: font family 'SimHei' not found in PostScript font database
## Warning: font family 'SimHei' not found in PostScript font database
## Warning: font family 'SimHei' not found in PostScript font database
## Warning: font family 'SimHei' not found in PostScript font database
## Warning: font family 'SimHei' not found in PostScript font database
## Warning: font family 'SimHei' not found in PostScript font database
## Warning: font family 'SimHei' not found in PostScript font database
## Warning: font family 'SimHei' not found in PostScript font database
## Warning: font family 'SimHei' not found in PostScript font database
## Warning: font family 'SimHei' not found in PostScript font database
## Warning: font family 'SimHei' not found in PostScript font database
## Warning: font family 'SimHei' not found in PostScript font database
## Warning: font family 'SimHei' not found in PostScript font database
## Warning: font family 'SimHei' not found in PostScript font database
## Warning: font family 'SimHei' not found in PostScript font database
## Warning: font family 'SimHei' not found in PostScript font database
## Warning: font family 'SimHei' not found in PostScript font database
## Warning: font family 'SimHei' not found in PostScript font database
## Warning: font family 'SimHei' not found in PostScript font database
## Warning: font family 'SimHei' not found in PostScript font database
## Warning: font family 'SimHei' not found in PostScript font database## Warning: Removed 3 rows containing missing values or values outside the scale range
## (`geom_line()`).## Warning in grid.Call(C_textBounds, as.graphicsAnnot(x$label), x$x, x$y, : font
## family 'SimHei' not found in PostScript font database
## Warning in grid.Call(C_textBounds, as.graphicsAnnot(x$label), x$x, x$y, : font
## family 'SimHei' not found in PostScript font database
## Warning in grid.Call(C_textBounds, as.graphicsAnnot(x$label), x$x, x$y, : font
## family 'SimHei' not found in PostScript font database
## Warning in grid.Call(C_textBounds, as.graphicsAnnot(x$label), x$x, x$y, : font
## family 'SimHei' not found in PostScript font database
## Warning in grid.Call(C_textBounds, as.graphicsAnnot(x$label), x$x, x$y, : font
## family 'SimHei' not found in PostScript font database
## Warning in grid.Call(C_textBounds, as.graphicsAnnot(x$label), x$x, x$y, : font
## family 'SimHei' not found in PostScript font database
## Warning in grid.Call(C_textBounds, as.graphicsAnnot(x$label), x$x, x$y, : font
## family 'SimHei' not found in PostScript font database
## Warning in grid.Call(C_textBounds, as.graphicsAnnot(x$label), x$x, x$y, : font
## family 'SimHei' not found in PostScript font database
## Warning in grid.Call(C_textBounds, as.graphicsAnnot(x$label), x$x, x$y, : font
## family 'SimHei' not found in PostScript font database
## Warning in grid.Call(C_textBounds, as.graphicsAnnot(x$label), x$x, x$y, : font
## family 'SimHei' not found in PostScript font database
## Warning in grid.Call(C_textBounds, as.graphicsAnnot(x$label), x$x, x$y, : font
## family 'SimHei' not found in PostScript font database
## Warning in grid.Call(C_textBounds, as.graphicsAnnot(x$label), x$x, x$y, : font
## family 'SimHei' not found in PostScript font database
## Warning in grid.Call(C_textBounds, as.graphicsAnnot(x$label), x$x, x$y, : font
## family 'SimHei' not found in PostScript font database
## Warning in grid.Call(C_textBounds, as.graphicsAnnot(x$label), x$x, x$y, : font
## family 'SimHei' not found in PostScript font database
## Warning in grid.Call(C_textBounds, as.graphicsAnnot(x$label), x$x, x$y, : font
## family 'SimHei' not found in PostScript font database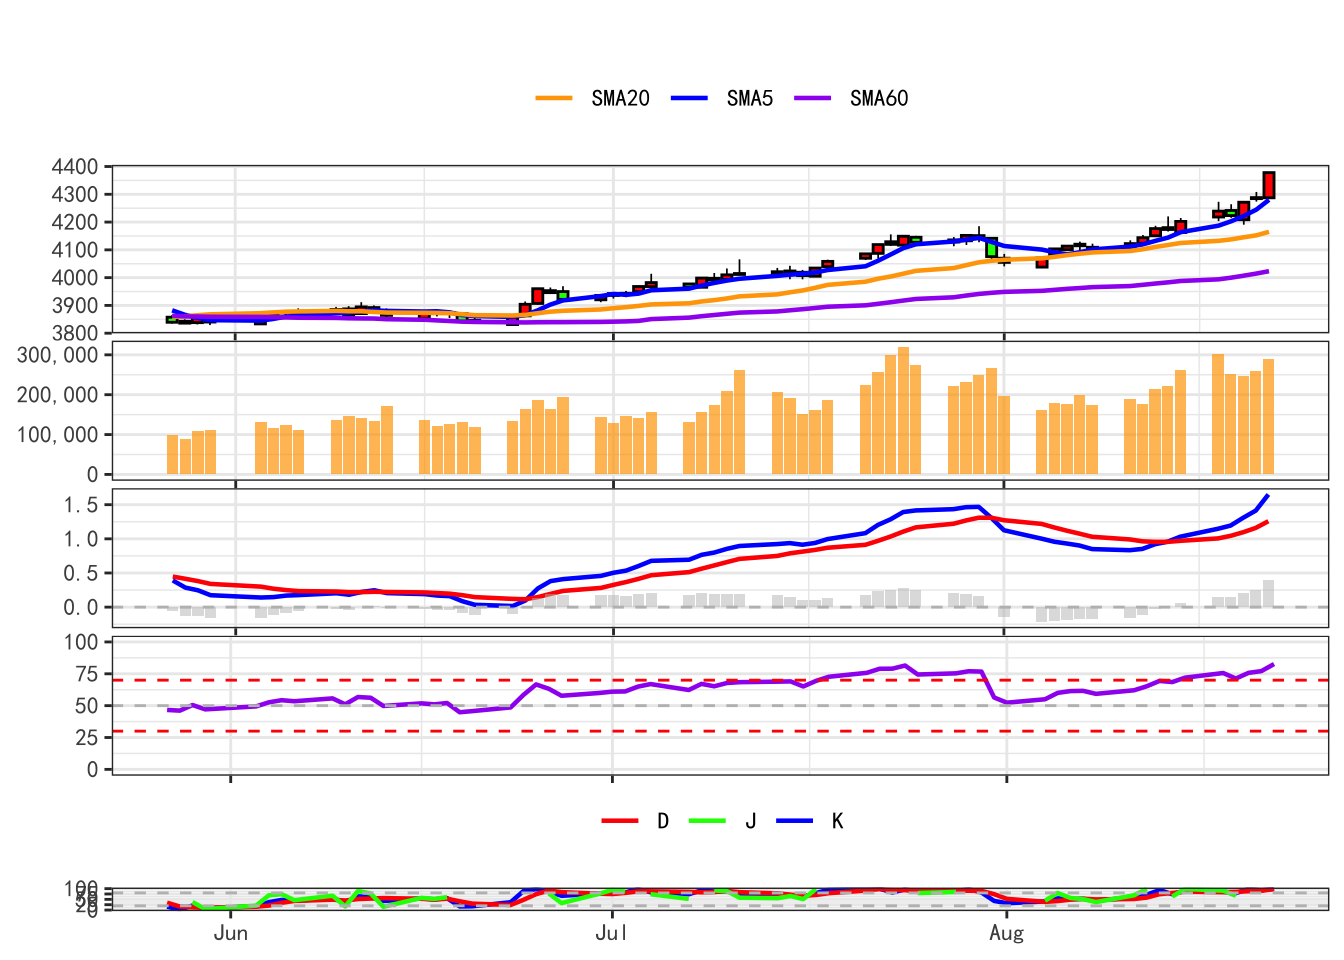
## Warning: Package `gridGraphics` is required to handle base-R plots.
## Substituting empty plot.